
Workflow Transform
Version: 1.2
Last Updated: July 30, 2026
The Workflow Transform protocol re-architects how work gets done. It takes the processes trapped in SOPs, tribal knowledge, and one person's head — and turns them into deployable organizational infrastructure: interactive workflow graphs, before/after transformation plans, executable LangGraph code, and full ROI analysis. This isn't automation for its own sake. It's eliminating the single points of failure that make your operations fragile.
Table of Contents
1. What Workflow Transform Does
Purpose
Workflow Transform answers the critical question: "What does this process actually look like when it no longer depends on one person?"
Most businesses don't have a process problem — they have a dependency problem. The 47-page SOP binder on the quality shelf, the step-by-step checklist taped to a monitor, the pricing logic that lives entirely in Jim's head — these aren't just manual processes. They're organizational debt. Every undocumented decision rule and single-person bottleneck is a fragility point that limits scale, increases risk, and depresses valuation.
Workflow Transform maps that debt, quantifies it, and produces the re-architecture plan: workflow graph, before/after comparison for every step, costed friction analysis, executable LangGraph code, and ROI projections.
Why Re-Architecture, Not Just Automation
| Automation Alone | Workflow Re-Architecture |
|---|---|
| Makes an existing step faster | Eliminates unnecessary steps entirely |
| Preserves the current org structure | Flattens dependencies and removes bottlenecks |
| Speeds up one person's work | Removes the need for that person to be involved |
| Treats symptoms (slow process) | Treats the cause (fragile process design) |
| ROI = time saved | ROI = time saved + risk eliminated + valuation protected |
Who Should Use It
| User Type | Use Case |
|---|---|
| Operations Leaders | Re-architecting processes to eliminate key-person dependencies |
| Process Improvement Teams | Mapping friction points and quantifying organizational debt |
| Automation Engineers | Generating LangGraph workflow code from SOPs |
| M&A / PE Teams | De-risking acquisitions by codifying tribal knowledge pre-close |
| IT Teams | Integration planning and system architecture |
| Consultants | Client process transformation with quantified ROI |
What You'll Get
| Output | Description |
|---|---|
| Executive Dashboard | Top-level metrics: time reduction, automation rate, savings, throughput |
| Workflow Graph | Interactive D3 visualization with typed and color-coded nodes |
| Process Steps | Before/after comparison for every step in the process |
| ROI Calculator | Annual savings, implementation cost, ROI percentage, and payback period |
| LangGraph Code | Production-ready Python workflow code with nodes, edges, and conditional routing |
| Friction Analysis | Costed organizational debt — every bottleneck with a dollar figure |
| Validation Report | Warnings, missing paths, and optimization suggestions |
2. Preparing Your Input
Ideal Input: Standard Operating Procedures
The best input is a detailed SOP document that describes a complete business process end-to-end.
| SOP Format | Works Well |
|---|---|
| Step-by-step procedures | Clear process flow the system can parse into nodes |
| Decision trees | Branch logic that maps to conditional edges |
| Role-based instructions | Responsibility mapping for human-in-loop identification |
| Checklists | Validation points that become verification nodes |
| Flowcharts | Visual processes with explicit paths |
SOP Quality Checklist
The richer your SOP, the more precise the transformation. Here is what a good SOP looks like versus a weak one.
Good SOP:
1. Customer submits RFQ via email or web portal
2. Sales coordinator opens RFQ and enters data into quote system (avg 15 min)
3. Look up customer in Epicor ERP for pricing tier and history (15 min)
4. If new customer: create account, assign default pricing tier
5. Engineer reviews drawing for part classification (30 min)
   - Standard parts: use catalog pricing
   - Custom parts: estimate based on material + labor
   - Engineered-to-order: full engineering review required
6. Calculate cost from BOM and current material prices (1 hour)
7. Apply pricing logic: customer tier discount, volume pricing, margin floor
   Note: Jim is the only person who knows the exception rules
8. If quote > $50K: route to manager for approval (avg 4 hour wait)
9. Generate quote BPMN/XML from template and email to customer (20 min)
10. Log quote in CRM and set follow-up reminder
Weak SOP:
Process quotes as they come in.
Make sure pricing is right.
Get approval if needed.
Send to customer.
Key SOP Elements
| Element | Why Important | Impact on Results |
|---|---|---|
| Steps | Clear sequence maps to workflow nodes | More steps = more granular automation |
| Decisions | Branch points become conditional edges | Missing decisions = incomplete graph |
| Timing | Duration per step enables ROI calculation | No timing = estimated savings only |
| Systems | Tools involved identify integration nodes | Named systems = specific integration plan |
| Roles | Who does what identifies human-in-loop | Role data = accurate automation rate |
| Exceptions | Edge cases become validation rules | Missing exceptions = incomplete coverage |
Input Formats
| Format | Notes |
|---|---|
| BPMN/XML | Best for formatted SOPs with tables and flowcharts |
| Markdown | Word documents with structured headings |
| TXT | Plain text, well-structured |
| Pasted text | Quick upload for shorter processes (minimum 50 characters) |
Tip: The system extracts the most value from SOPs that include specific timings, system names, and decision criteria. A 47-page SOP with detailed steps will produce dramatically better results than a one-page summary.
3. Running an Analysis
Step 1: Access Workflow Transform
From the main dashboard, click the Workflow Transform card or navigate directly to /dashboard/workflow.
Step 2: Upload Your SOP
Step 3: Add Context
| Field | Purpose | Example |
|---|---|---|
| Process Name | Identifies the workflow | "Quote-to-Cash" |
| Department | Organizational context | "Sales Operations" |
| Current Tools | Existing systems to integrate | "Epicor ERP, Outlook, Excel" |
| Goals | Transformation priorities | "Reduce cycle time, eliminate single-point-of-failure" |
Step 4: Run Analysis
MCOS processes your SOP through four stages, visible in the sidebar status panel:
| Layer | Name | What It Does |
|---|---|---|
| Layer 1 | SOP Parser | Parses document structure, extracts steps and decision points |
| Layer 2 | Graph Generator | Builds the workflow graph with typed nodes and edges |
| Layer 3 | ROI Calculator | Calculates savings, friction costs, and efficiency gains |
| Layer 4 | Code Compiler | Generates executable LangGraph Python code |
Each layer shows a green indicator when complete and an amber pulse when active.
4. Executive Dashboard
The Executive Dashboard is the landing view when your analysis completes. It provides a complete overview of the transformation opportunity.
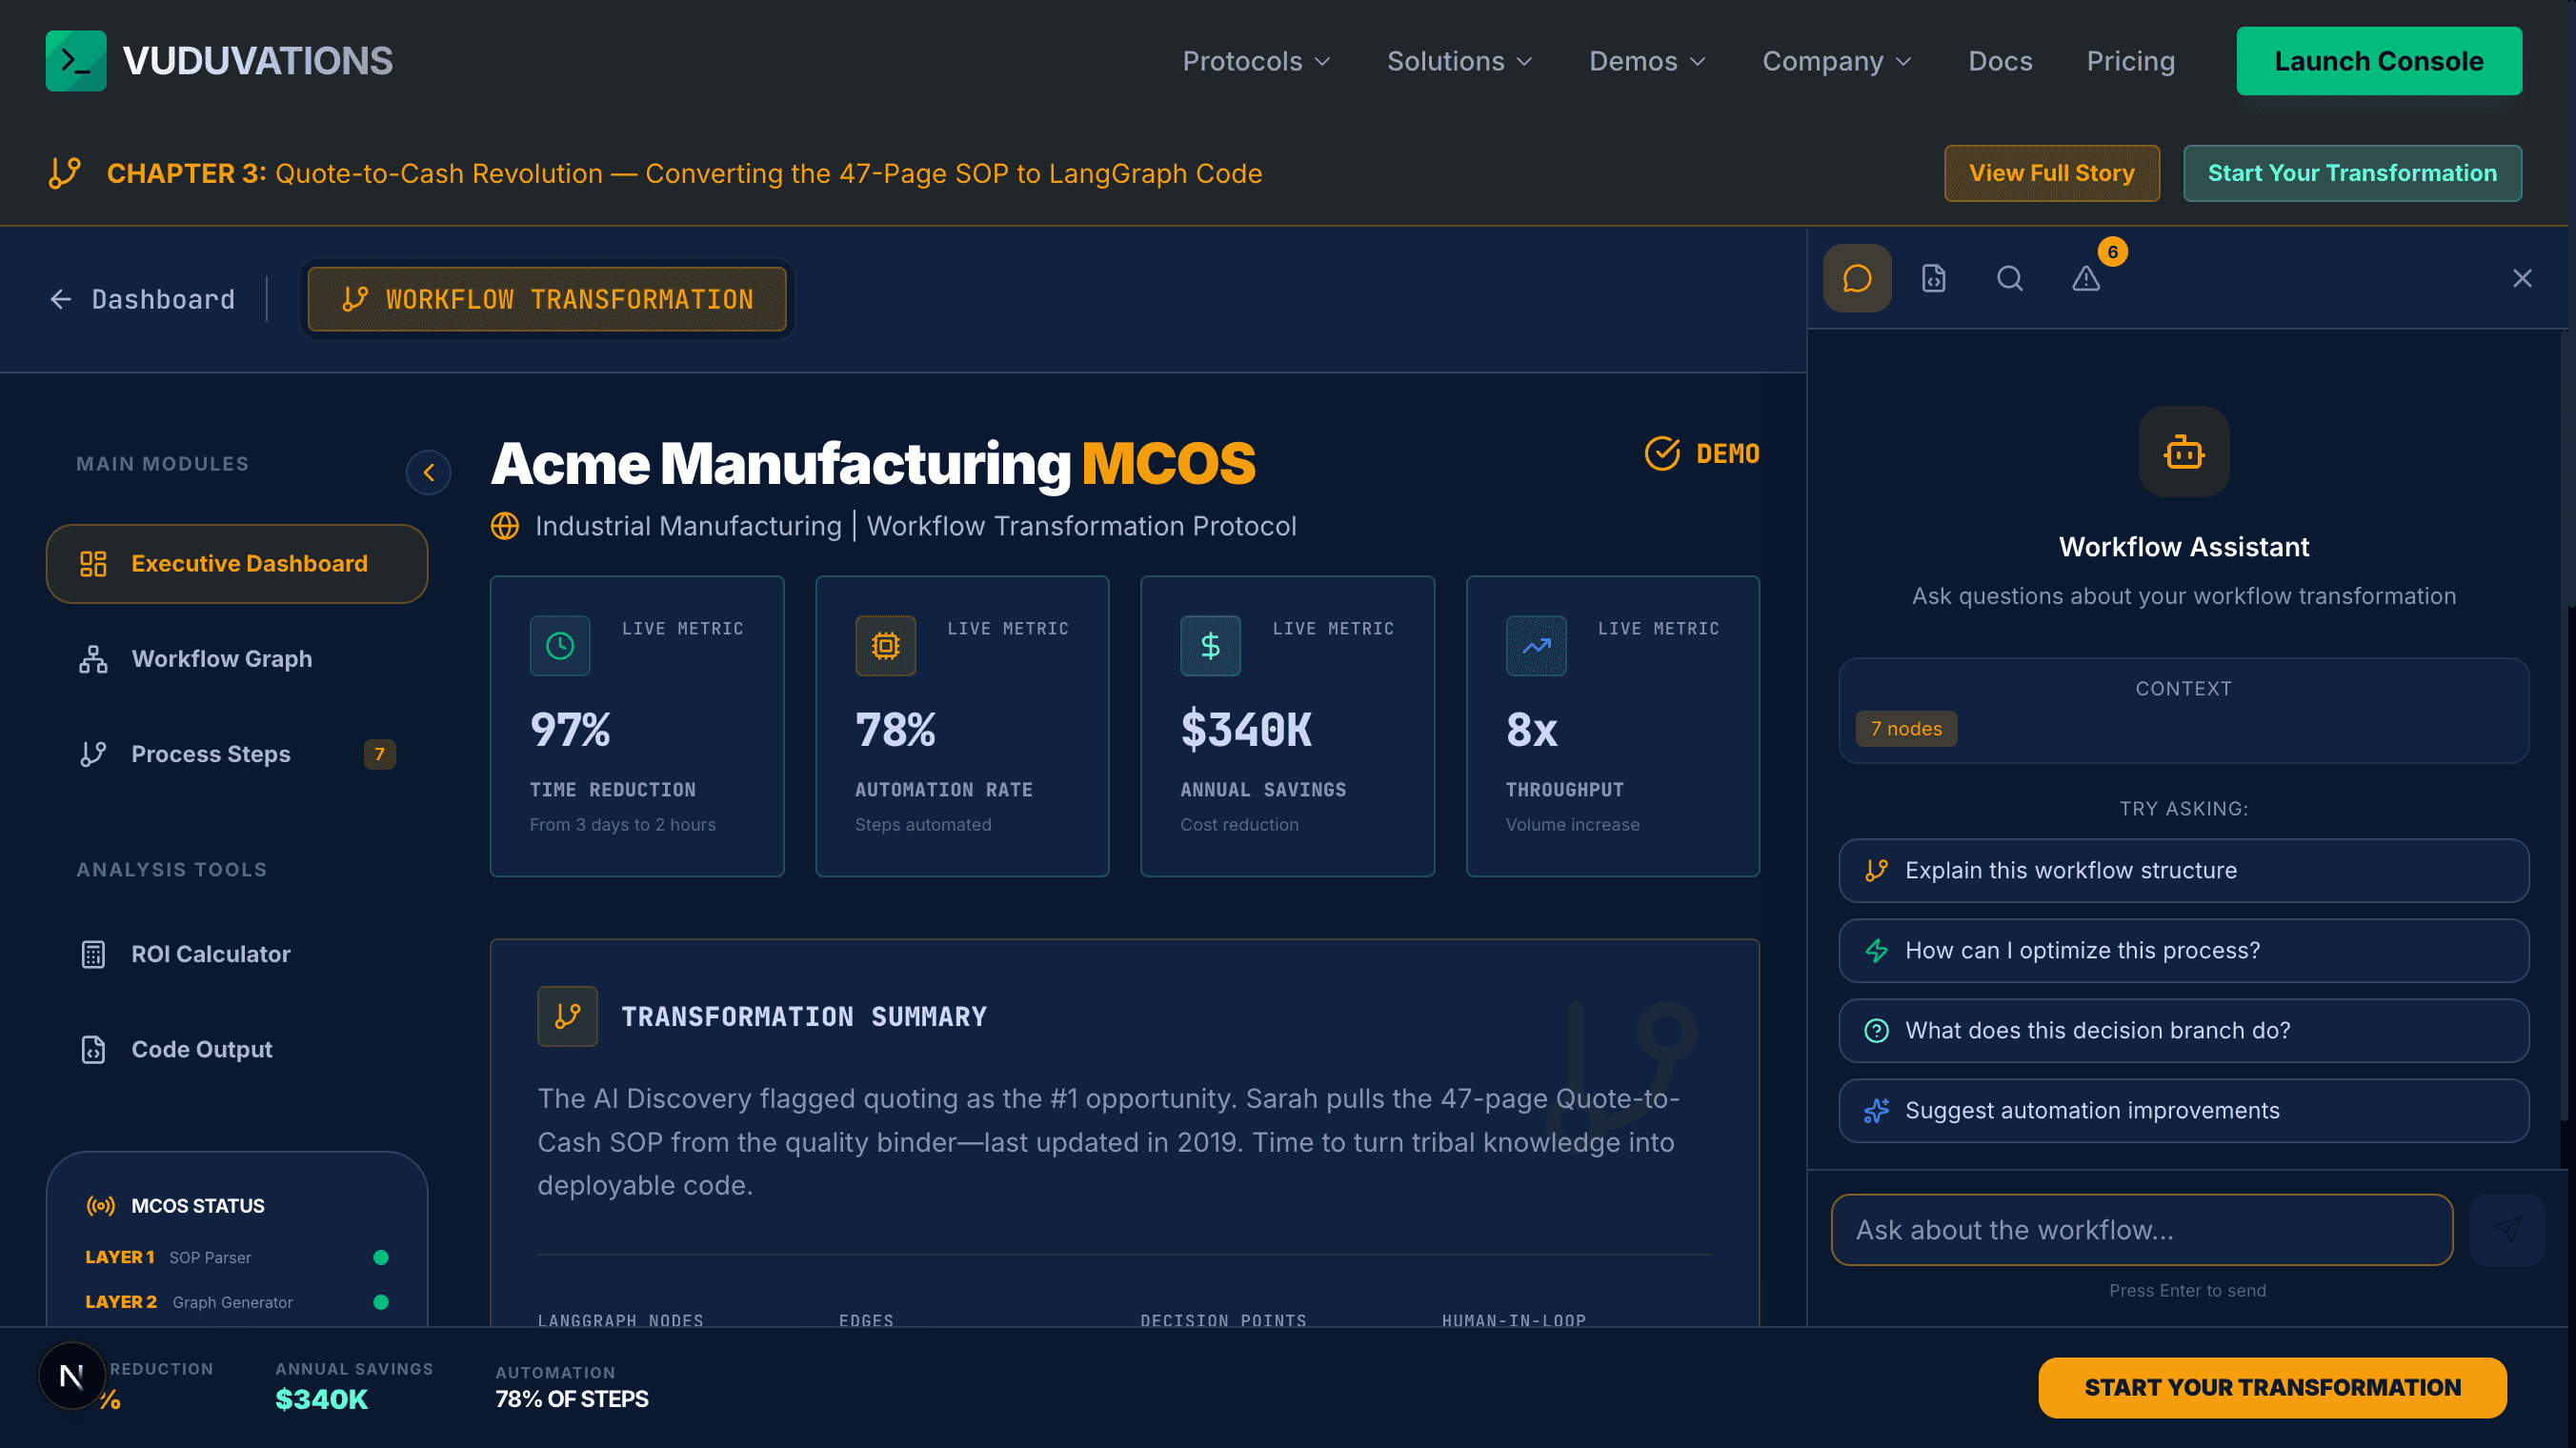
Top Metrics
Four key performance indicators appear at the top of the dashboard:
| Metric | What It Shows | Acme Example |
|---|---|---|
| Time Reduction | Percentage decrease in cycle time | 97% (from 3 days to 2 hours) |
| Automation Rate | Percentage of steps that can be automated | 78% of steps automated |
| Annual Savings | Projected cost reduction per year | $340K cost reduction |
| Throughput | Volume increase enabled by automation | 8x volume increase |
Transformation Summary
Below the metrics, a narrative summary provides the key story — what was found, why it matters, and what the transformation enables. In the Acme Manufacturing demo, this reads:
"The AI Discovery flagged quoting as the #1 opportunity. Sarah pulls the 47-page Quote-to-Cash SOP from the quality binder — last updated in 2019. Time to turn tribal knowledge into deployable code."
The summary also displays four LangGraph statistics:
| Stat | What It Shows | Acme Example |
|---|---|---|
| Nodes | Total workflow steps in the generated graph | 14 |
| Edges | Connections between nodes | 18 |
| Decision Points | Conditional routing branches | 6 |
| Human-in-Loop | Steps requiring human judgment | 2 |
AI Discovery Connection
If your workflow originates from an AI Discovery use case (as in the Acme story), a cross-reference card connects the two analyses:
| Field | Acme Example |
|---|---|
| Use Case | Intelligent Quote Generation |
| Savings | $340K/year |
| Confidence | High |
This traceability ensures every workflow re-architecture links back to the strategic opportunity that justified it — from discovery through transformation to deployed code.
SOP Quick Stats
Four stat cards at the bottom of the Executive Dashboard show the raw input metrics:
| Metric | Acme Example |
|---|---|
| SOP Pages | 47 |
| Process Steps | 34 |
| Before | 3 days (red) |
| After | 2 hours (green) |
5. Workflow Graph
The Workflow Graph tab displays an interactive D3 force-directed visualization of your transformed process.
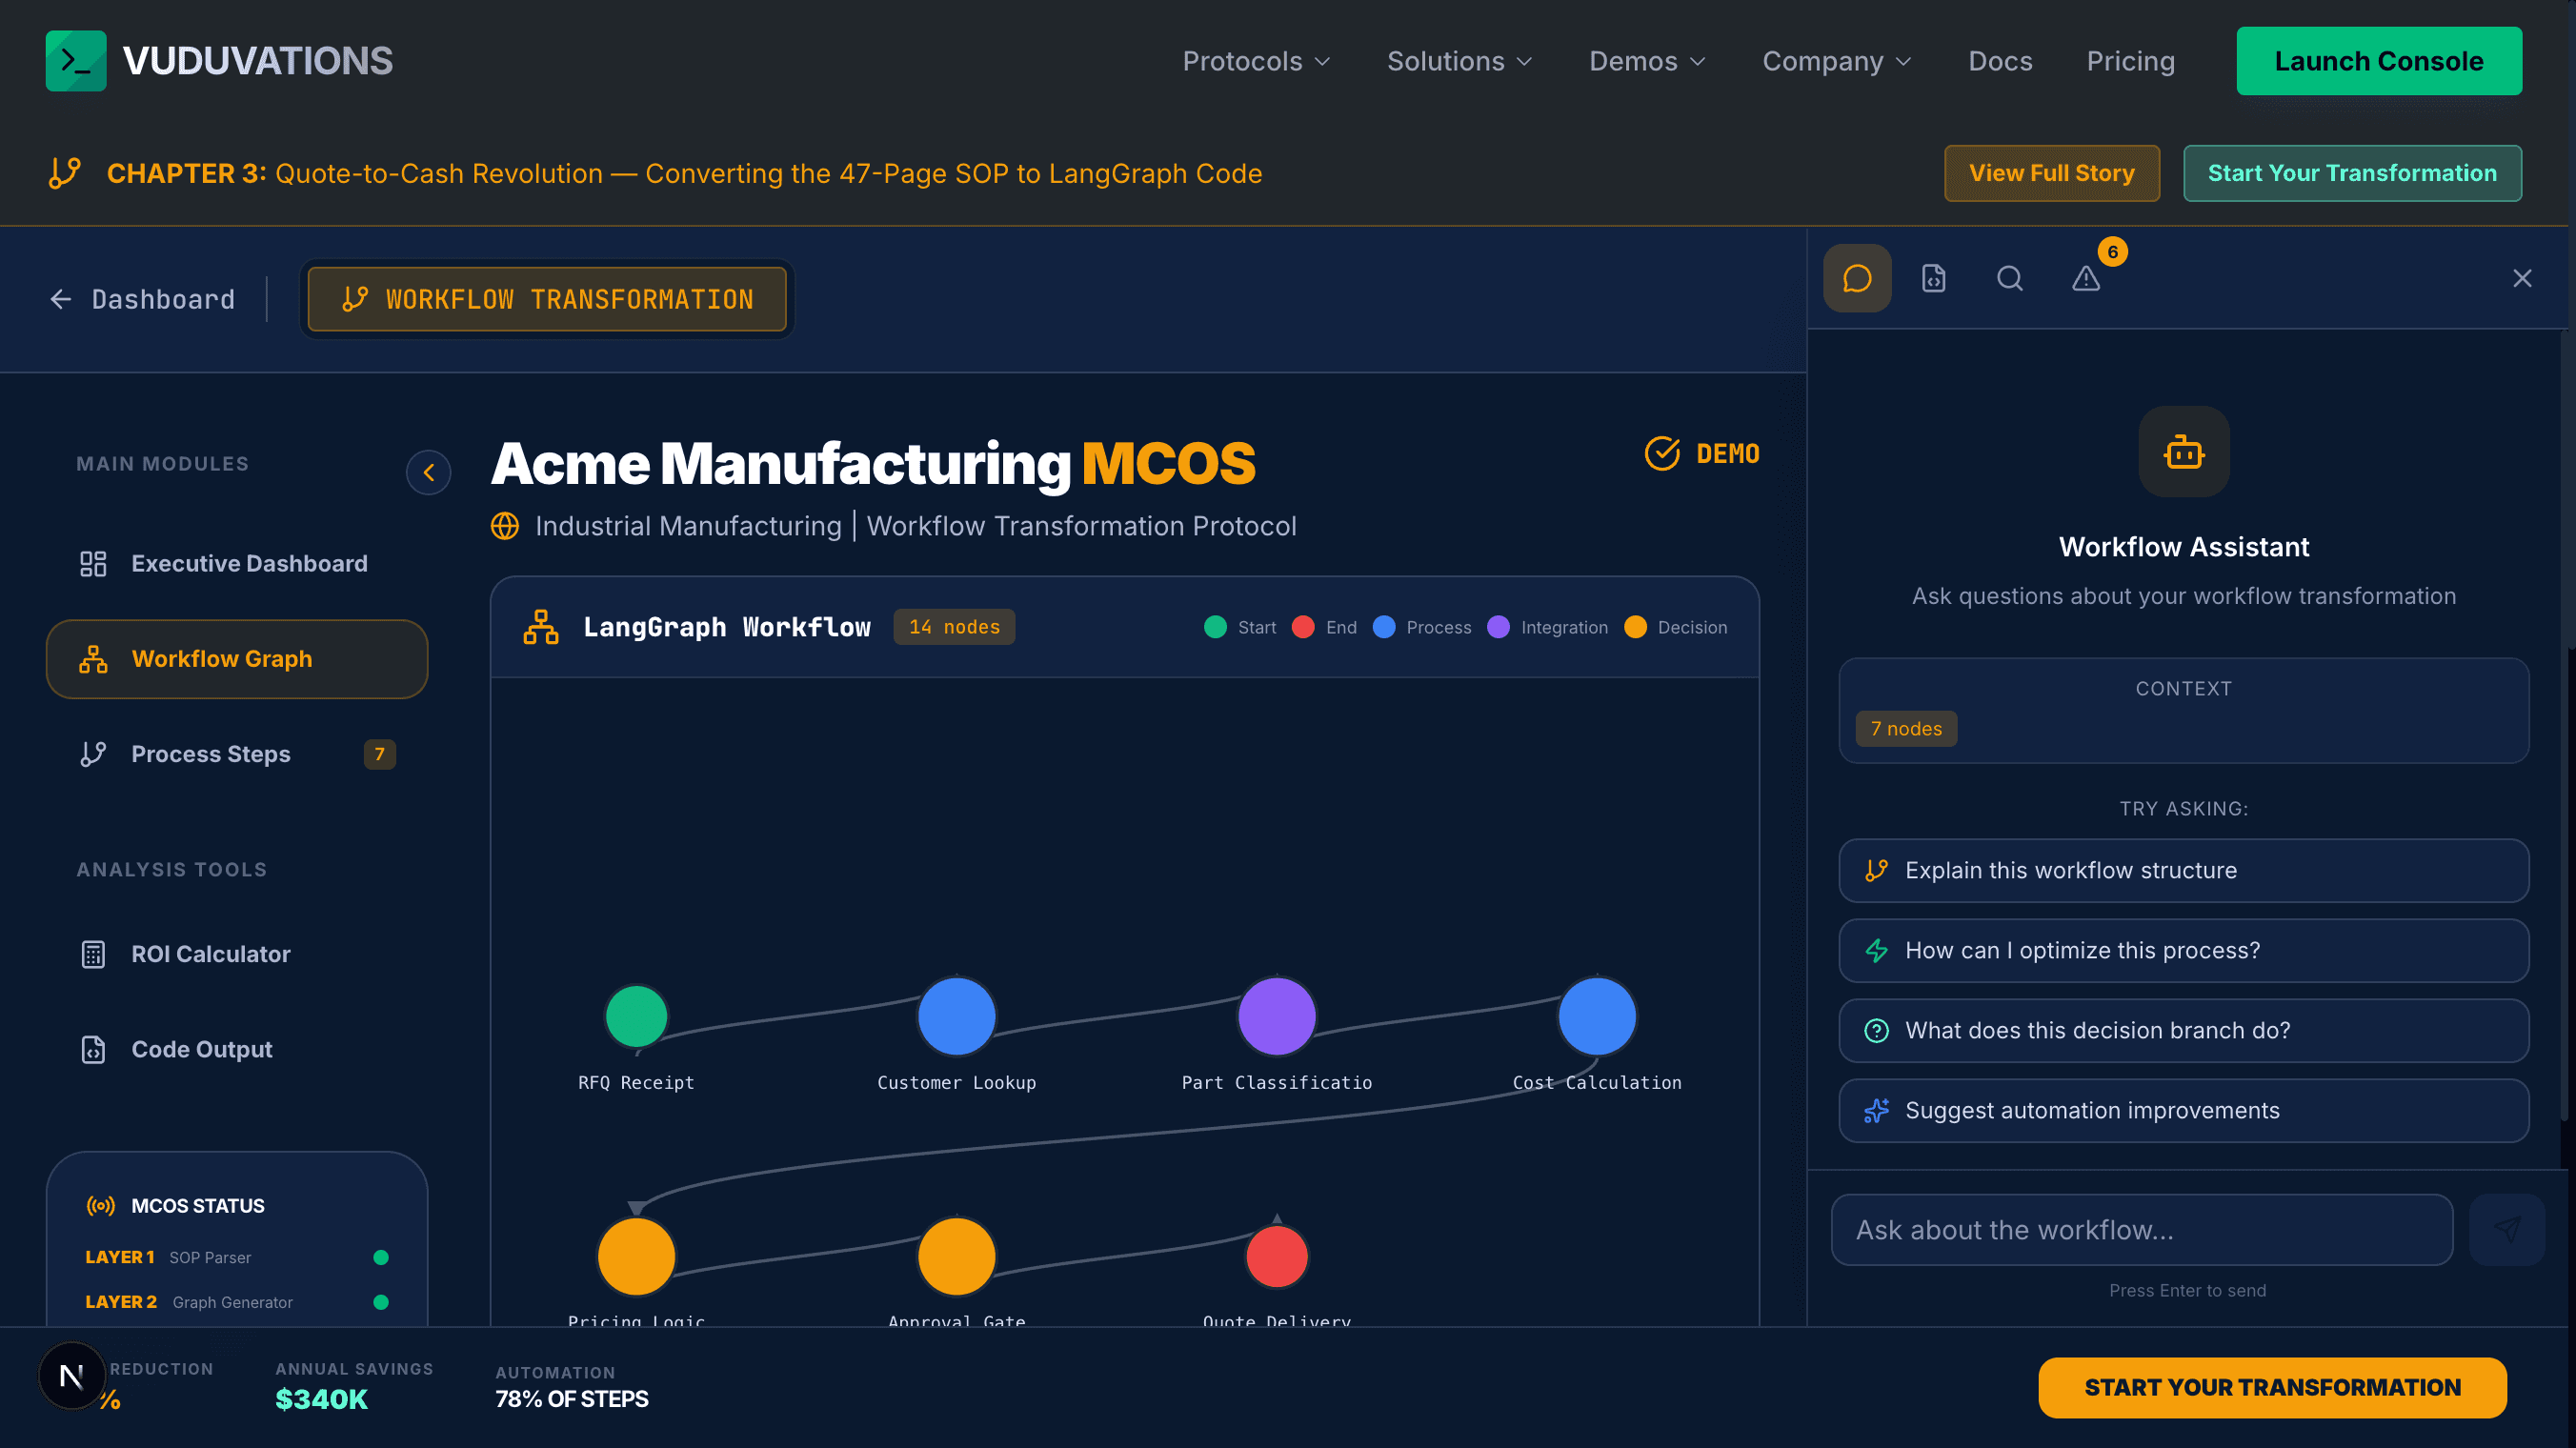
Graph Header
The header shows:
Node Types and Colors
| Node Type | Color | Represents | Example |
|---|---|---|---|
| Start | Green (#10b981) | Process entry point | RFQ Receipt |
| End | Red (#ef4444) | Process completion | Quote Delivery |
| Process | Blue (#3b82f6) | Standard processing step | Cost Calculation |
| Integration | Purple (#8b5cf6) | External system connection | Customer Lookup (Epicor) |
| Decision | Amber (#FACC15) | Conditional branch point | Approval Gate |
Acme Quote-to-Cash Nodes
The Acme demo displays 7 primary nodes in sequence:
| # | Node | Type | Purpose |
|---|---|---|---|
| 1 | RFQ Receipt | Start | Parse incoming request for quote |
| 2 | Customer Lookup | Process | Retrieve customer history and pricing tier |
| 3 | Part Classification | Integration | Categorize parts by complexity |
| 4 | Cost Calculation | Process | Compute from BOM and labor estimates |
| 5 | Pricing Logic | Decision | Apply rules, margins, and exceptions |
| 6 | Approval Gate | Decision | Route for manager approval if needed |
| 7 | Quote Delivery | End | Generate and send quote document |
Navigating the Graph
| Action | How |
|---|---|
| Pan | Click and drag on the canvas |
| Zoom | Scroll wheel or pinch gesture |
| Select Node | Click on any node circle |
| View Details | Selected node opens in the Inspector sidebar tab |
| Auto-Fit | Graph auto-fits on load; resize the browser to refit |
Connections
Lines between nodes show process flow:
Tip: Click any node in the graph to open the Inspector tab in the right sidebar. This is the fastest way to explore node details without switching views.
6. Process Steps
The Process Steps tab displays every workflow step as a card with a side-by-side before/after comparison showing exactly what changes with automation.
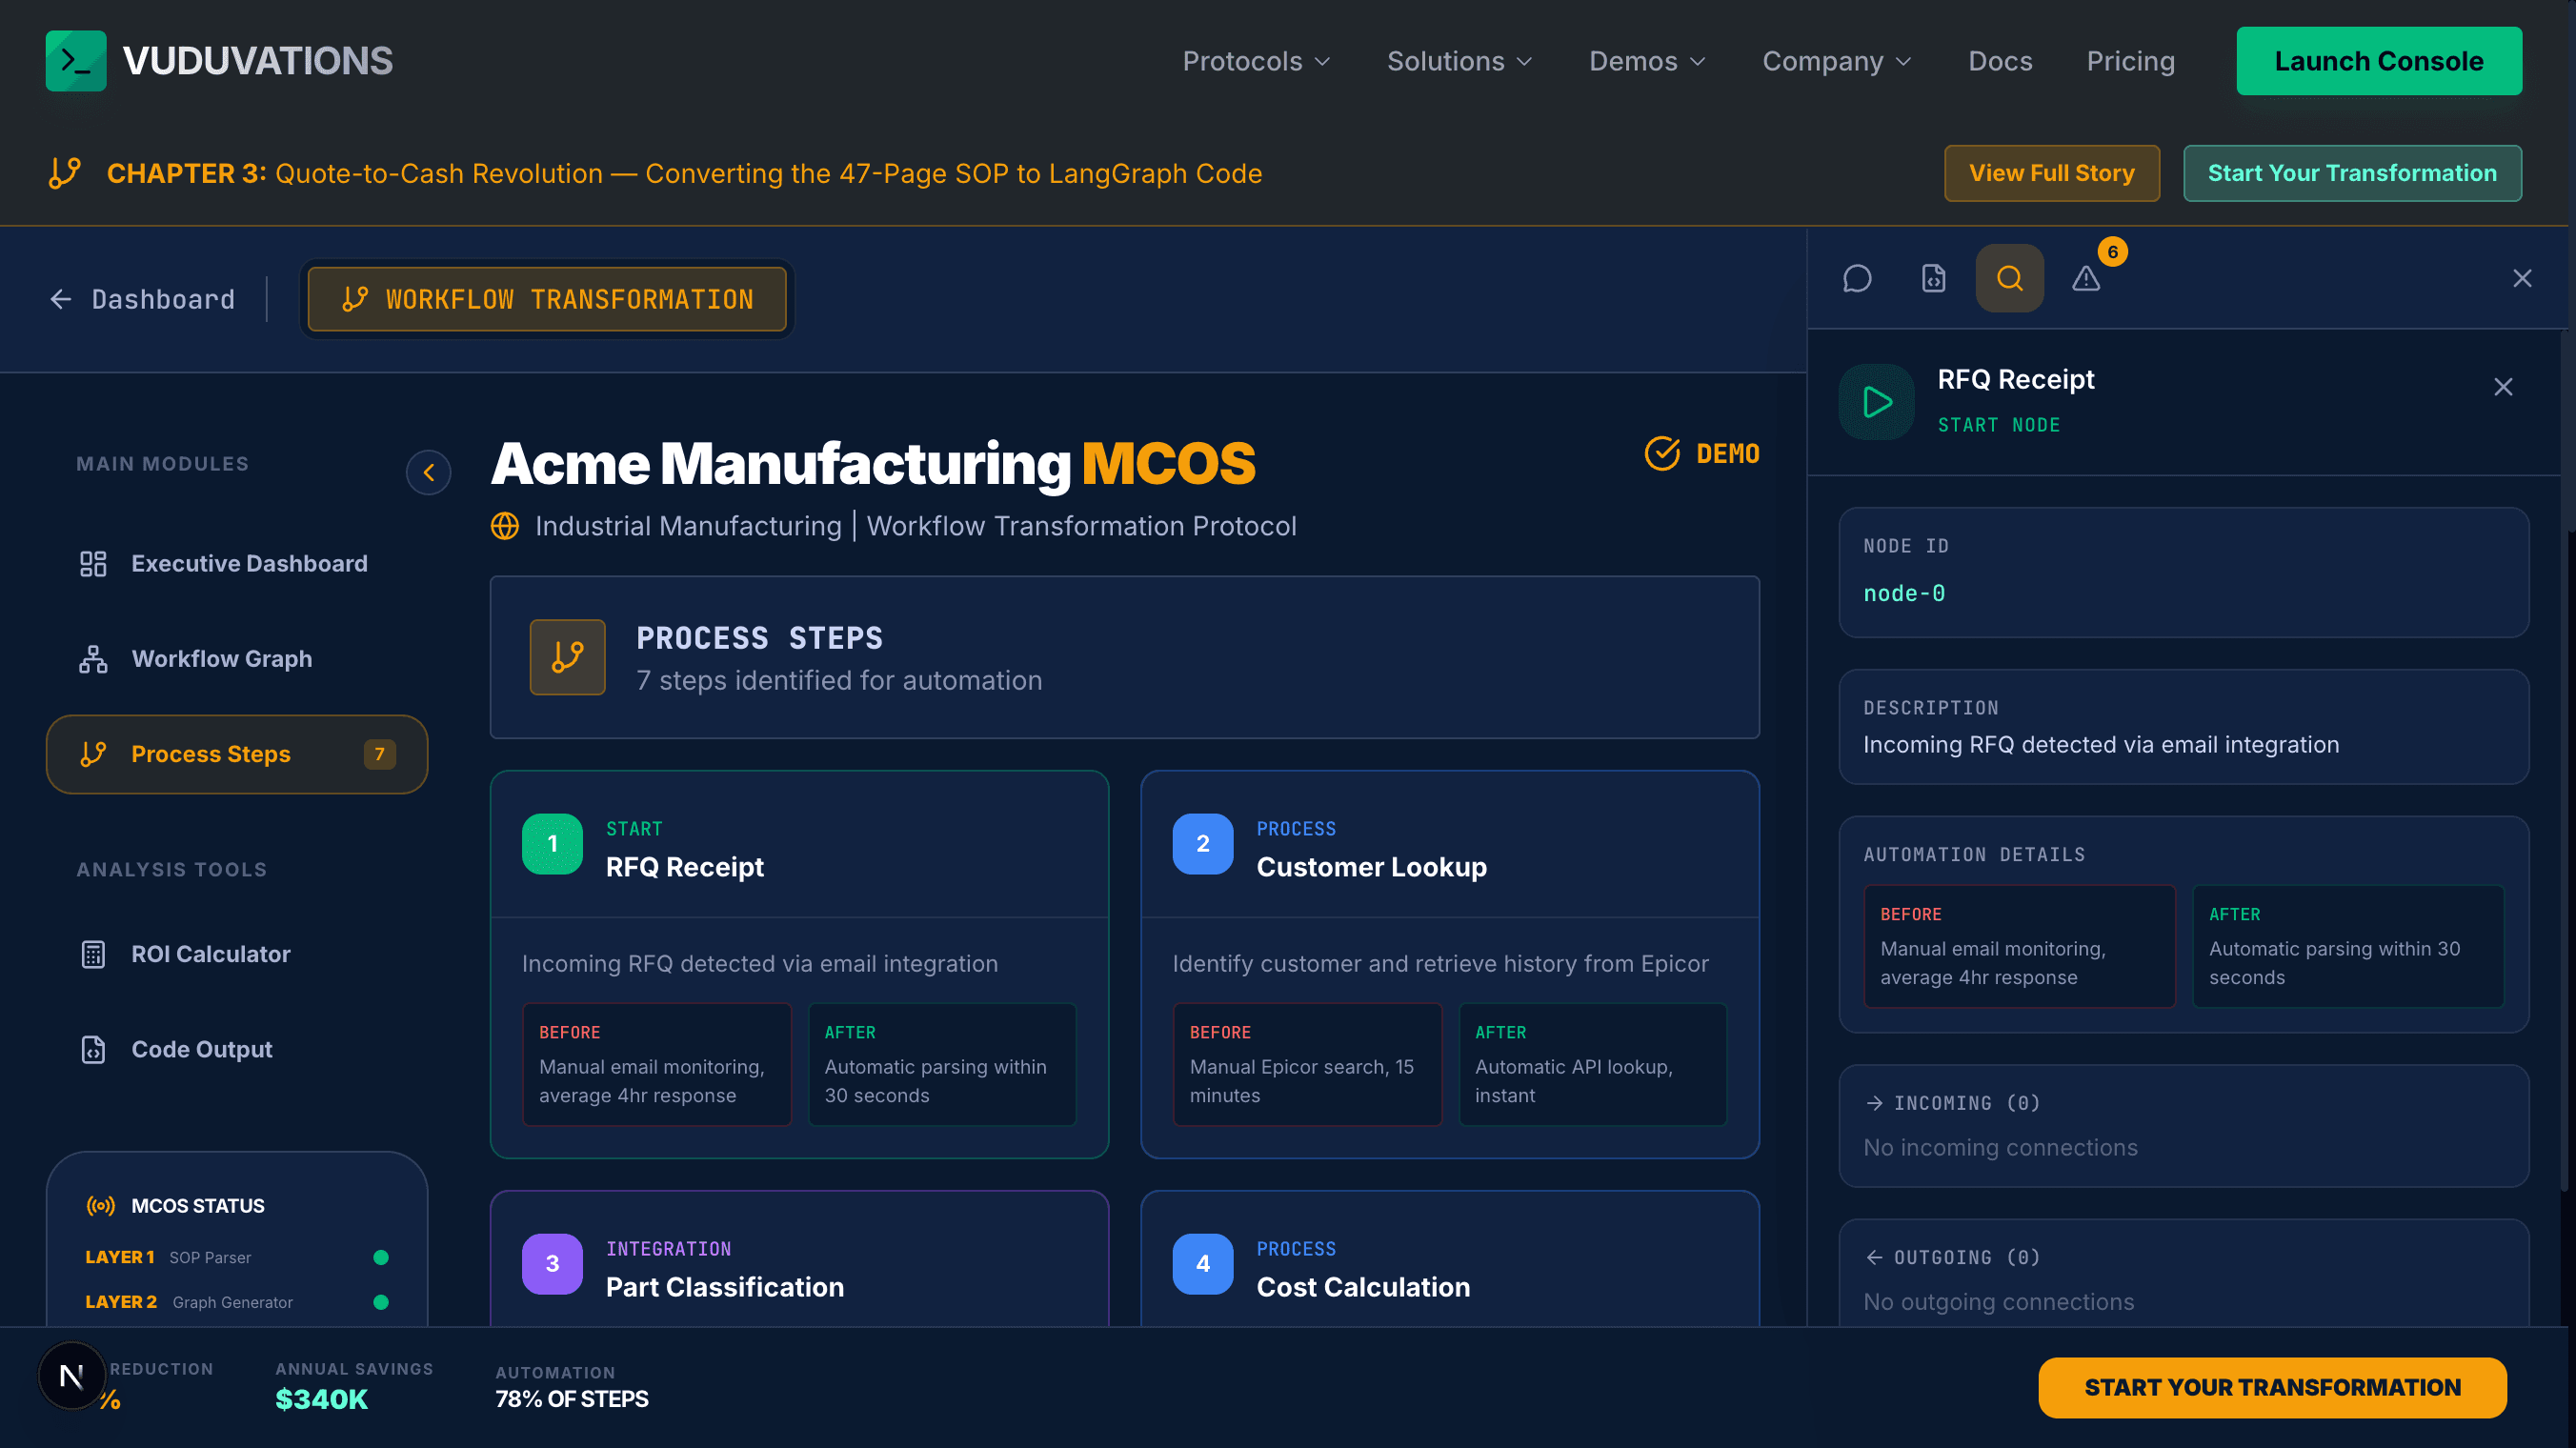
Step Cards
Each card shows:
All 7 Steps: Acme Quote-to-Cash
| # | Step | Type | Before | After |
|---|---|---|---|---|
| 1 | RFQ Receipt | Start | Manual email monitoring, avg 4hr response | Automatic parsing within 30 seconds |
| 2 | Customer Lookup | Process | Manual Epicor search, 15 minutes | Automatic API lookup, instant |
| 3 | Part Classification | Integration | Engineer reviews each drawing, 30 minutes | CV model classifies in 10 seconds |
| 4 | Cost Calculation | Process | Spreadsheet lookups, 1 hour | Real-time API pricing, 5 seconds |
| 5 | Pricing Logic | Decision | Jim's mental model, required his review | Encoded rules from Jim's pricing logic |
| 6 | Approval Gate | Decision | 100% require Jim approval | 85% auto-approve, 15% escalate |
| 7 | Quote Delivery | End | Manual email from template, 20 minutes | Auto-generated and sent, instant |
Reading the Before/After Comparison
The before/after layout is designed to make the transformation impact immediately obvious:
Key insight from the Acme example: Step 5 (Pricing Logic) is the real story. Jim's mental model isn't just a bottleneck — it's a $62K/year fragility that depresses the company's valuation by making the entire quoting process dependent on one person. Encoding those rules into the workflow doesn't just save time. It removes the key-person risk that Key Person Audit flagged and M&A Diligence priced into the deal. Step 6 shows the result: 85% of quotes no longer need Jim at all.
7. ROI Calculator
The ROI Calculator tab provides a complete financial analysis of the transformation.
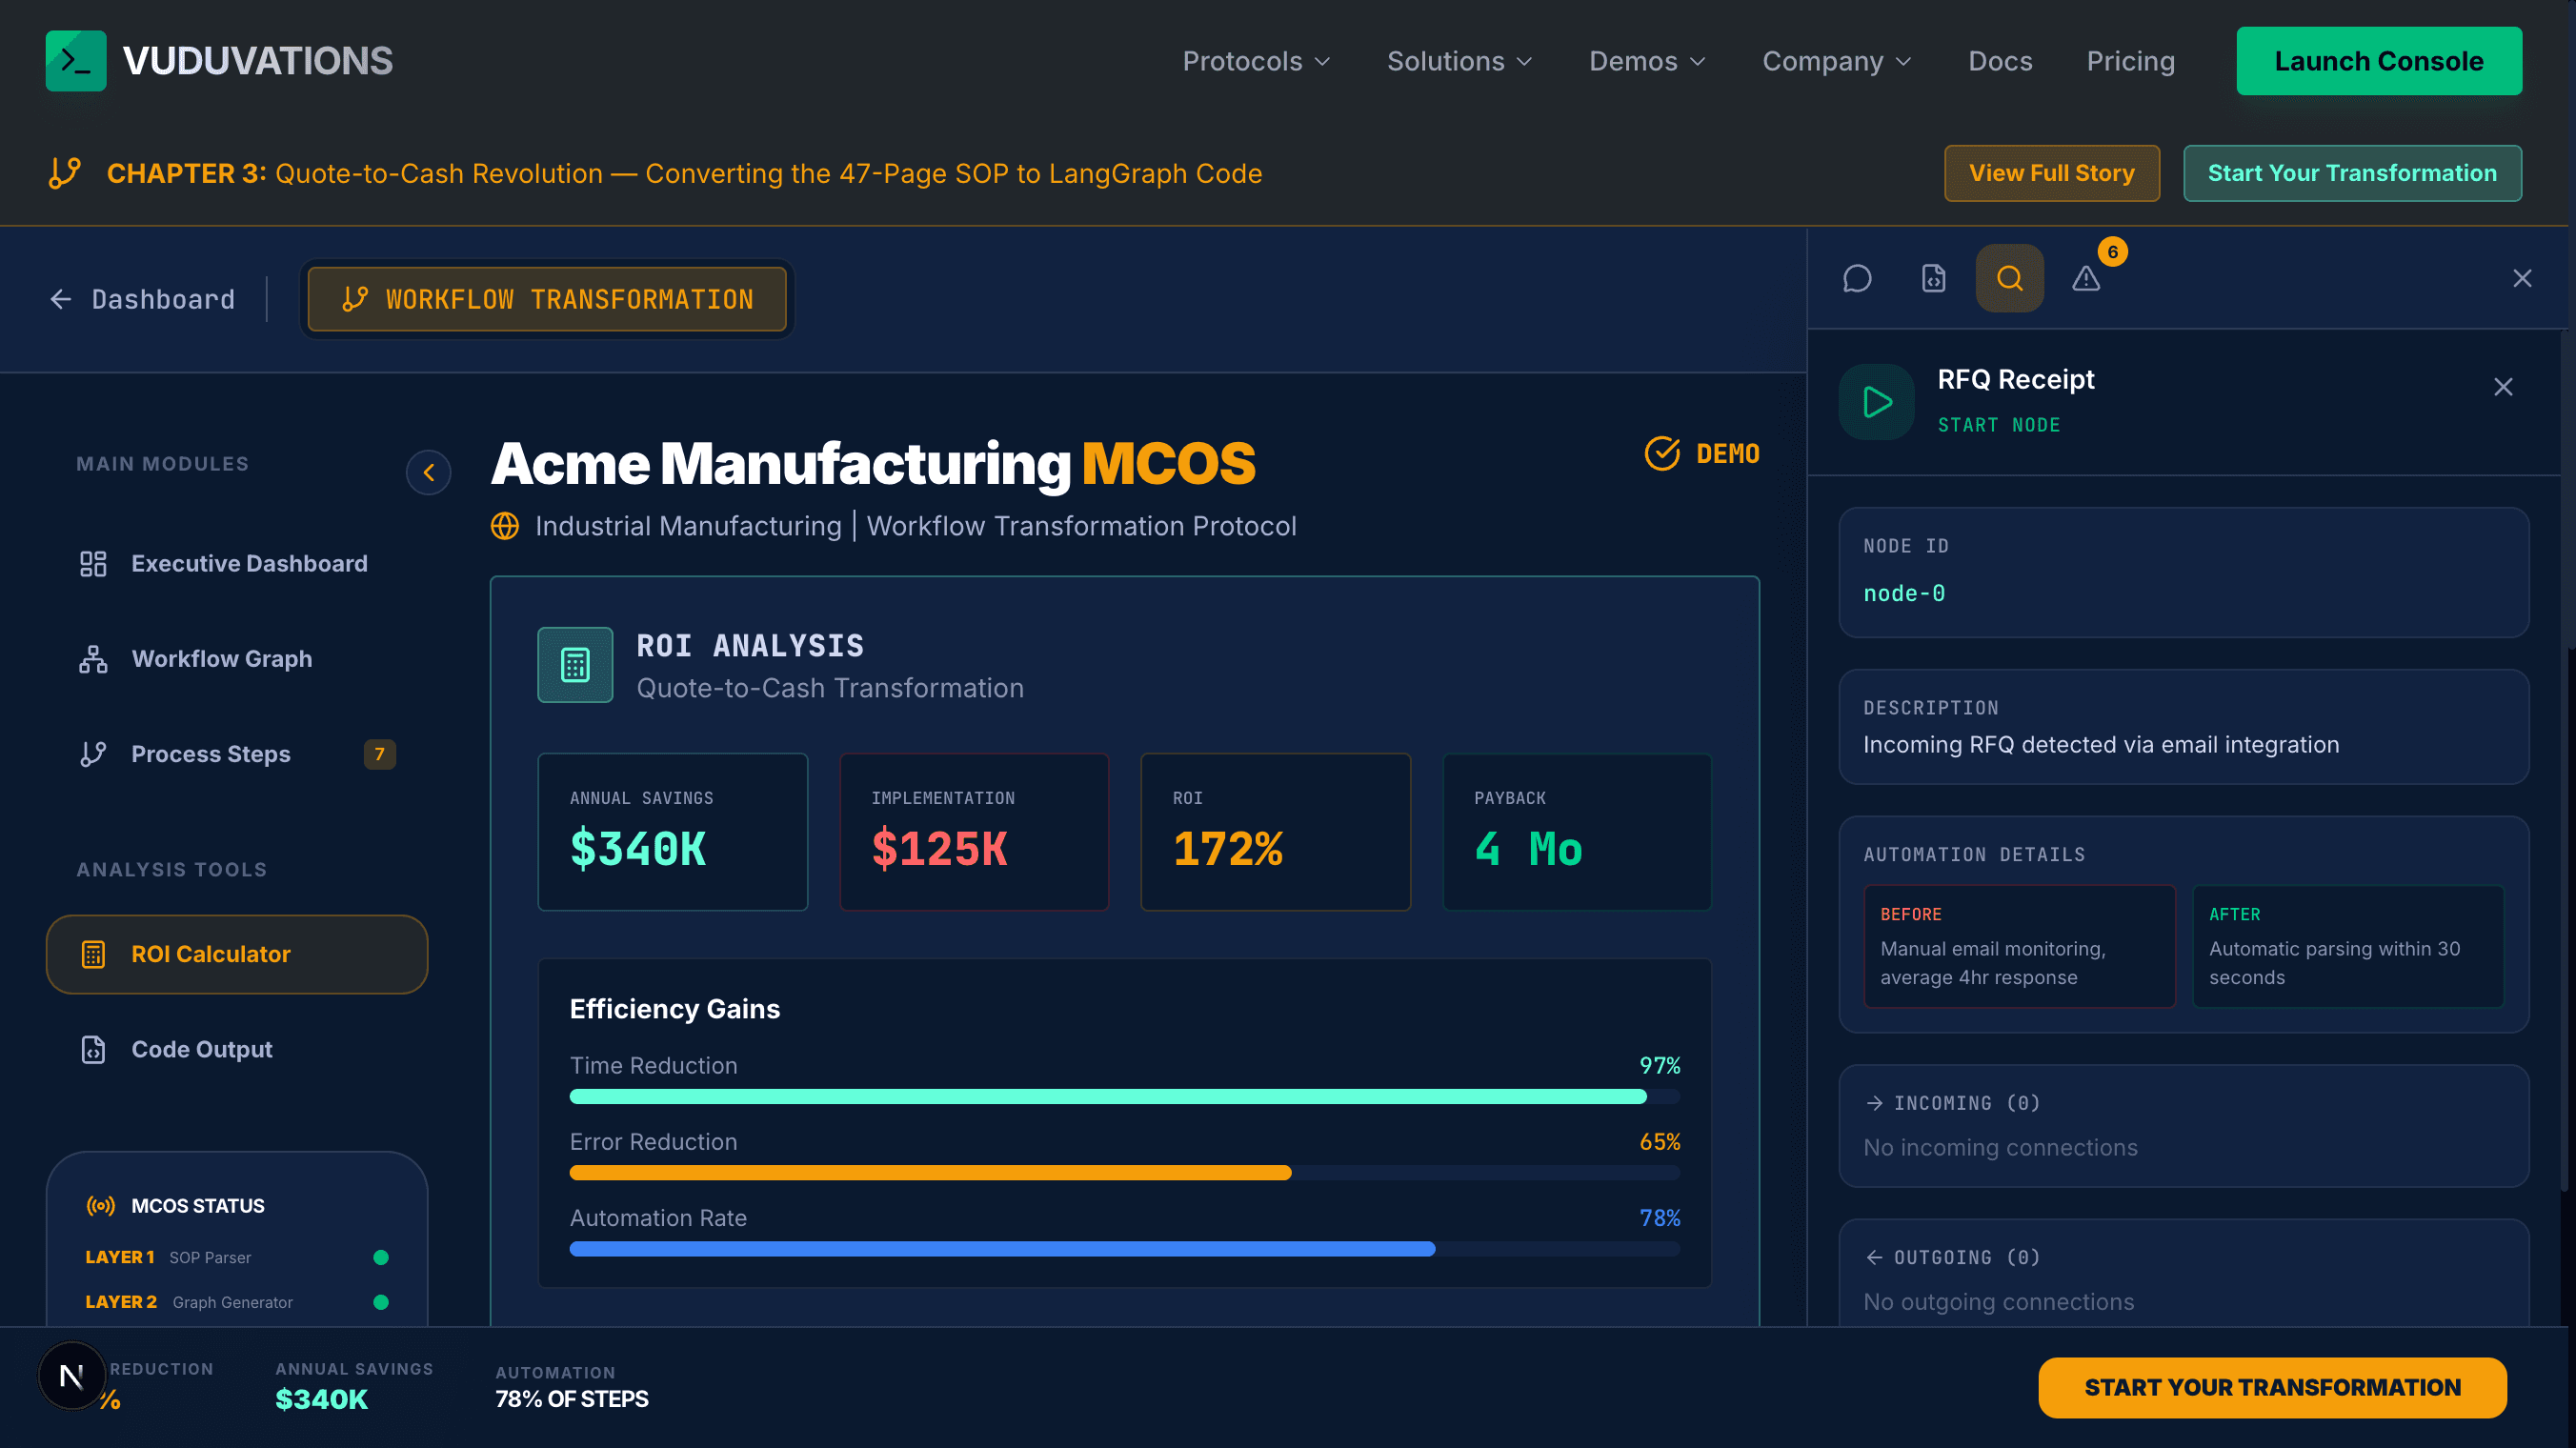
Top-Level Financial Metrics
| Metric | Acme Example | What It Means |
|---|---|---|
| Annual Savings | $340K | Projected yearly cost reduction from automation |
| Implementation | $125K | One-time cost to build and deploy the workflow |
| ROI | 172% | Return on investment percentage |
| Payback | 4 months | Time to recoup the implementation cost |
Efficiency Gains
Three progress bars show the operational improvements:
| Efficiency Metric | Acme Value | What It Measures |
|---|---|---|
| Time Reduction | 97% | Cycle time decrease (3 days to 2 hours) |
| Error Reduction | 65% | Decrease in process errors from automation |
| Automation Rate | 78% | Percentage of steps handled without human intervention |
How ROI Is Calculated
The ROI calculation derives from the before/after step data:
| Component | How It's Calculated |
|---|---|
| Time savings | Sum of (before_time - after_time) across all steps, multiplied by volume |
| Error cost reduction | Current error rate cost minus projected automated error rate cost |
| Labor reallocation | Hours freed from manual steps, valued at loaded labor rate |
| Implementation cost | Engineering, integration, testing, and deployment |
| Payback period | Implementation cost / (monthly savings) |
8. Code Output
The Code Output tab shows the generated LangGraph Python code — a production-ready workflow definition you can take directly into your codebase.
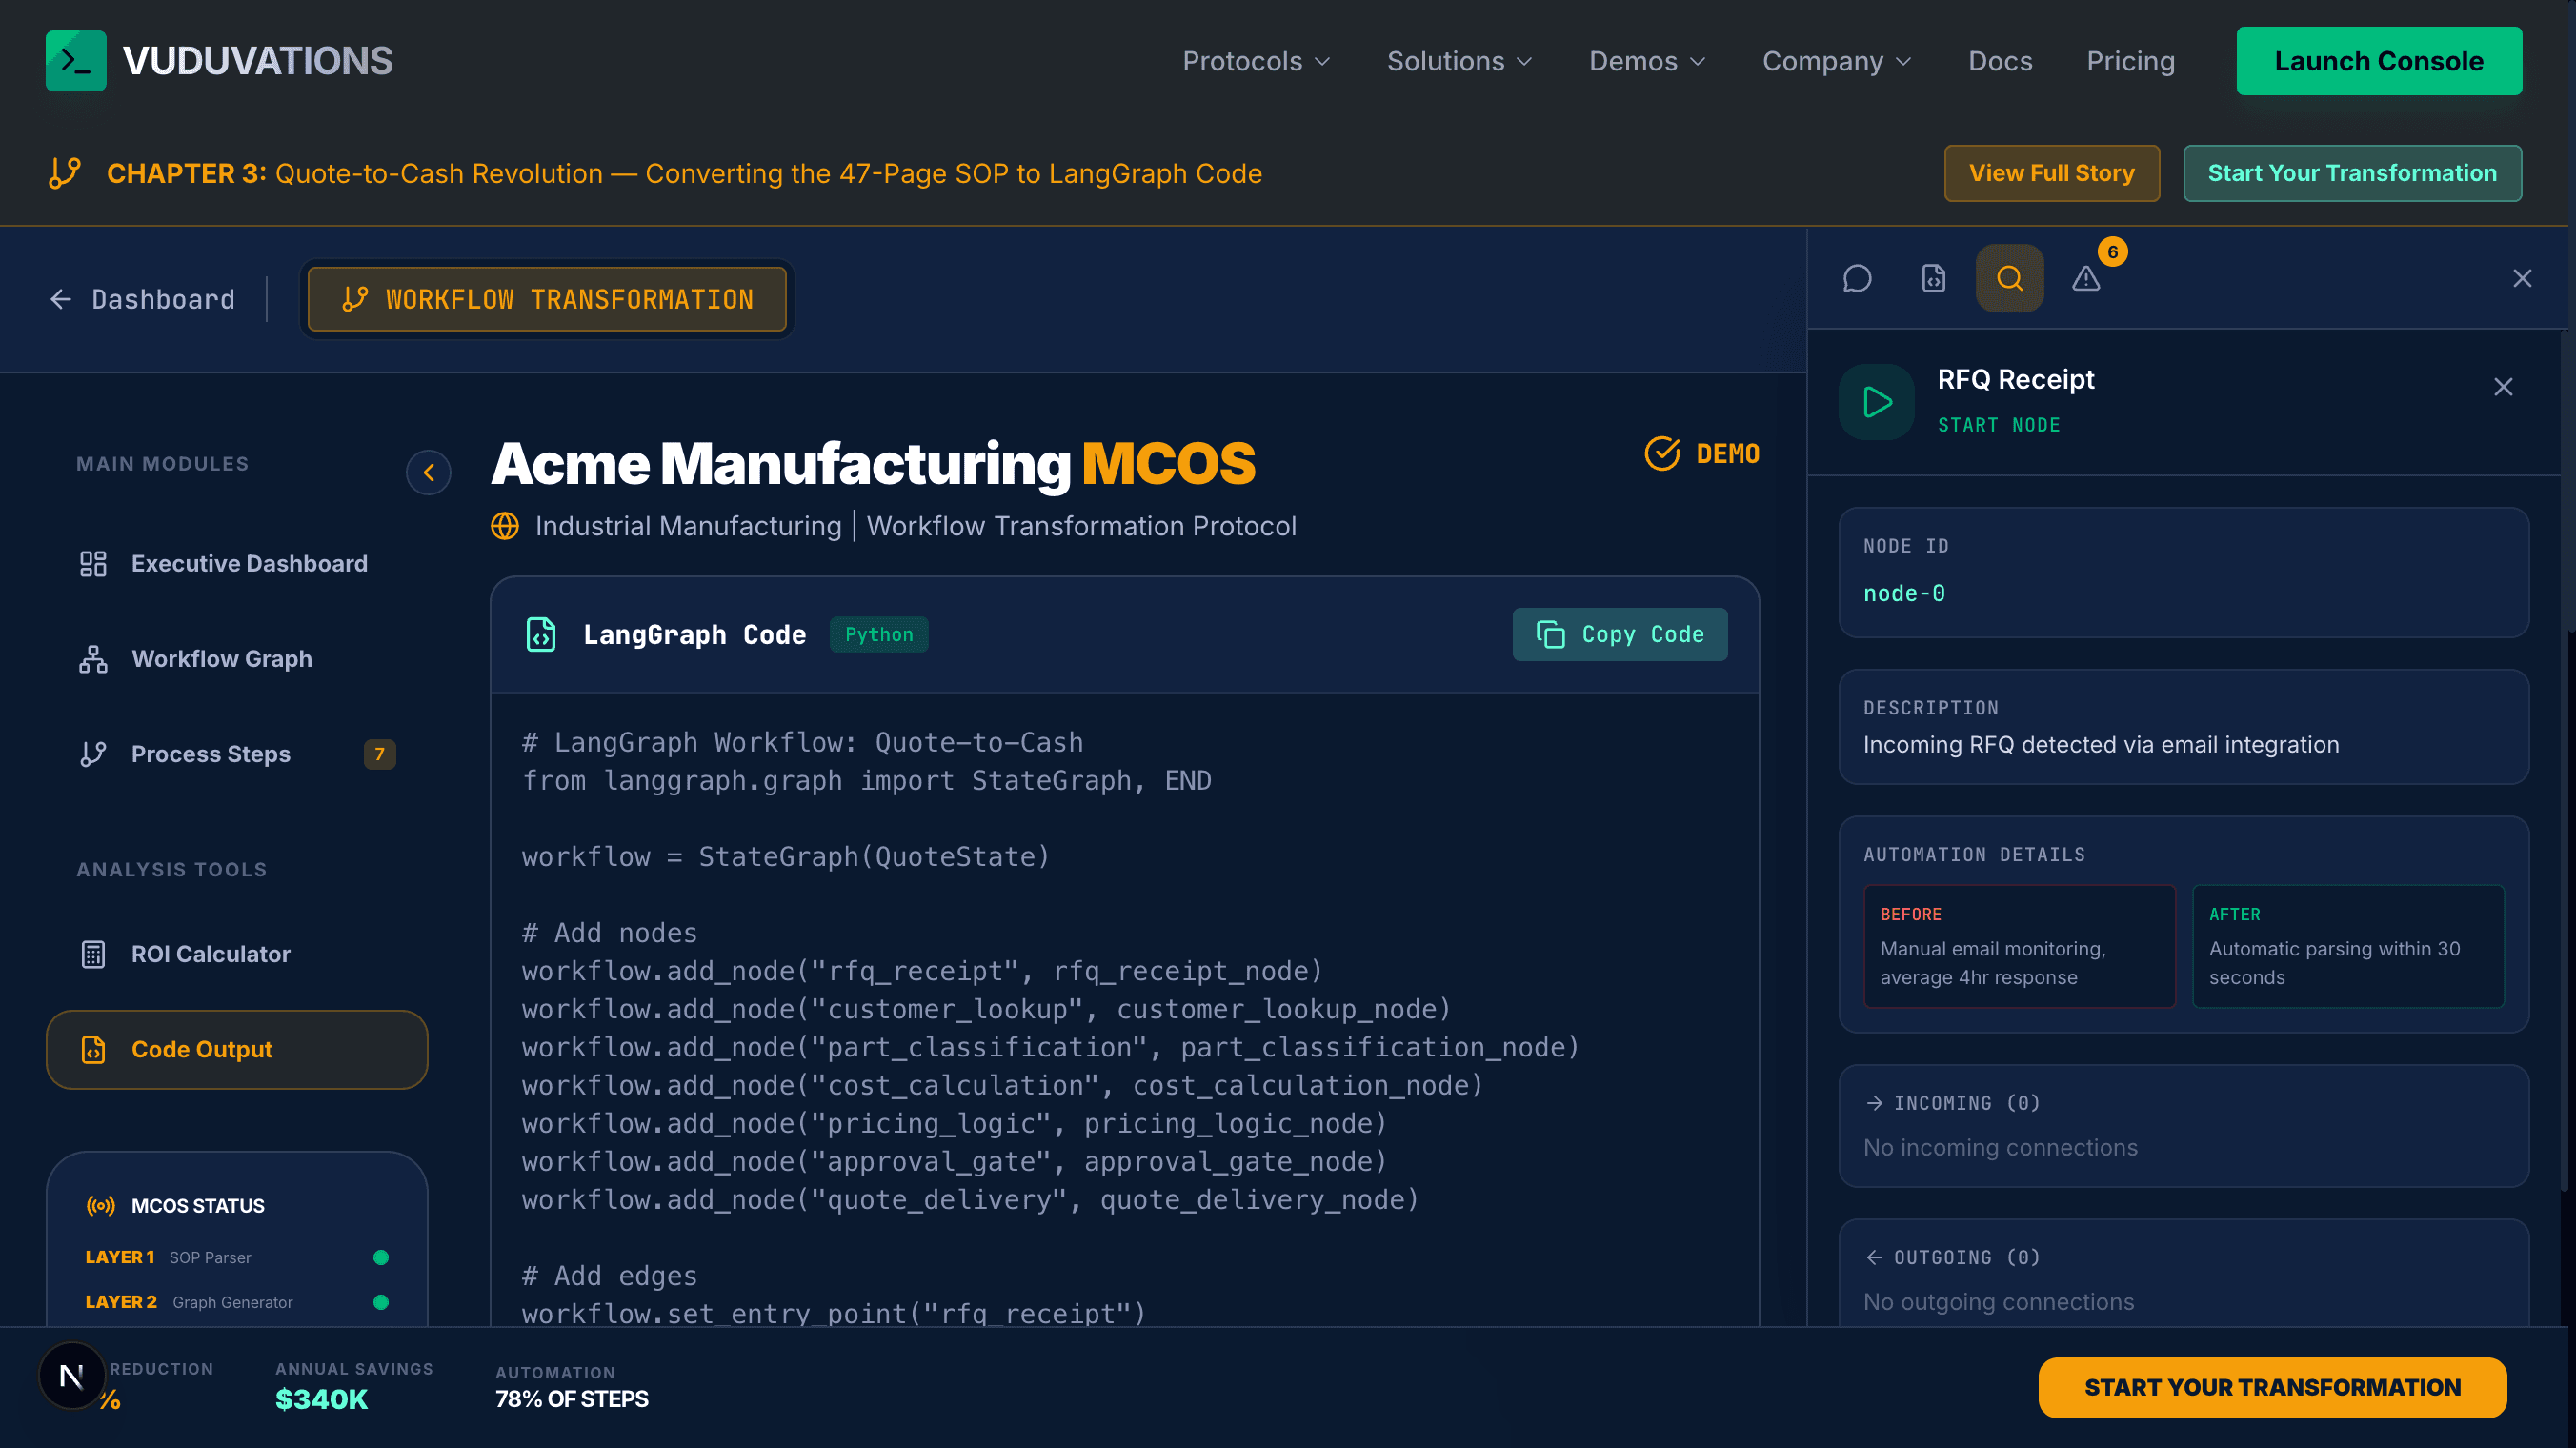
Code View
The code panel includes:
Generated Code Structure
The Acme Quote-to-Cash code includes:
from langgraph.graph import StateGraph, END
from typing import TypedDict, Annotated

class QuoteState(TypedDict):
    rfq_data: dict
    customer_info: dict
    part_classification: str
    cost_estimate: float
    final_price: float
    approval_status: str
    quote_document: str

workflow = StateGraph(QuoteState)

# Node functions
workflow.add_node("rfq_receipt", rfq_receipt_node)
workflow.add_node("customer_lookup", customer_lookup_node)
workflow.add_node("part_classification", part_classification_node)
workflow.add_node("cost_calculation", cost_calculation_node)
workflow.add_node("pricing_logic", pricing_logic_node)
workflow.add_node("approval_gate", approval_gate_node)
workflow.add_node("quote_delivery", quote_delivery_node)

# Edges
workflow.set_entry_point("rfq_receipt")
workflow.add_edge("rfq_receipt", "customer_lookup")
workflow.add_edge("customer_lookup", "part_classification")
workflow.add_edge("part_classification", "cost_calculation")
workflow.add_edge("cost_calculation", "pricing_logic")
workflow.add_conditional_edges(
    "pricing_logic",
    route_approval,
    {"auto_approve": "quote_delivery", "escalate": "approval_gate"}
)
workflow.add_edge("approval_gate", "quote_delivery")
workflow.add_edge("quote_delivery", END)

app = workflow.compile()
Key Code Features
| Feature | Description |
|---|---|
| StateGraph | Typed state dictionary tracks data through the workflow |
| Node functions | Each step is an independent function that receives and returns state |
| set_entry_point | Defines the first node in the workflow |
| add_edge | Sequential connections between nodes |
| add_conditional_edges | Decision routing based on state (e.g., auto_approve vs. escalate) |
| END | Terminal node that completes the workflow |
Using the Generated Code
pip install langgraphNote: The generated code provides the workflow skeleton with documented stubs. You implement the business logic inside each node function. The conditional routing, state management, and graph structure are ready to use.
9. Using the Sidebar
The right sidebar provides four interactive tabs for exploring your workflow in depth.
Chat Tab
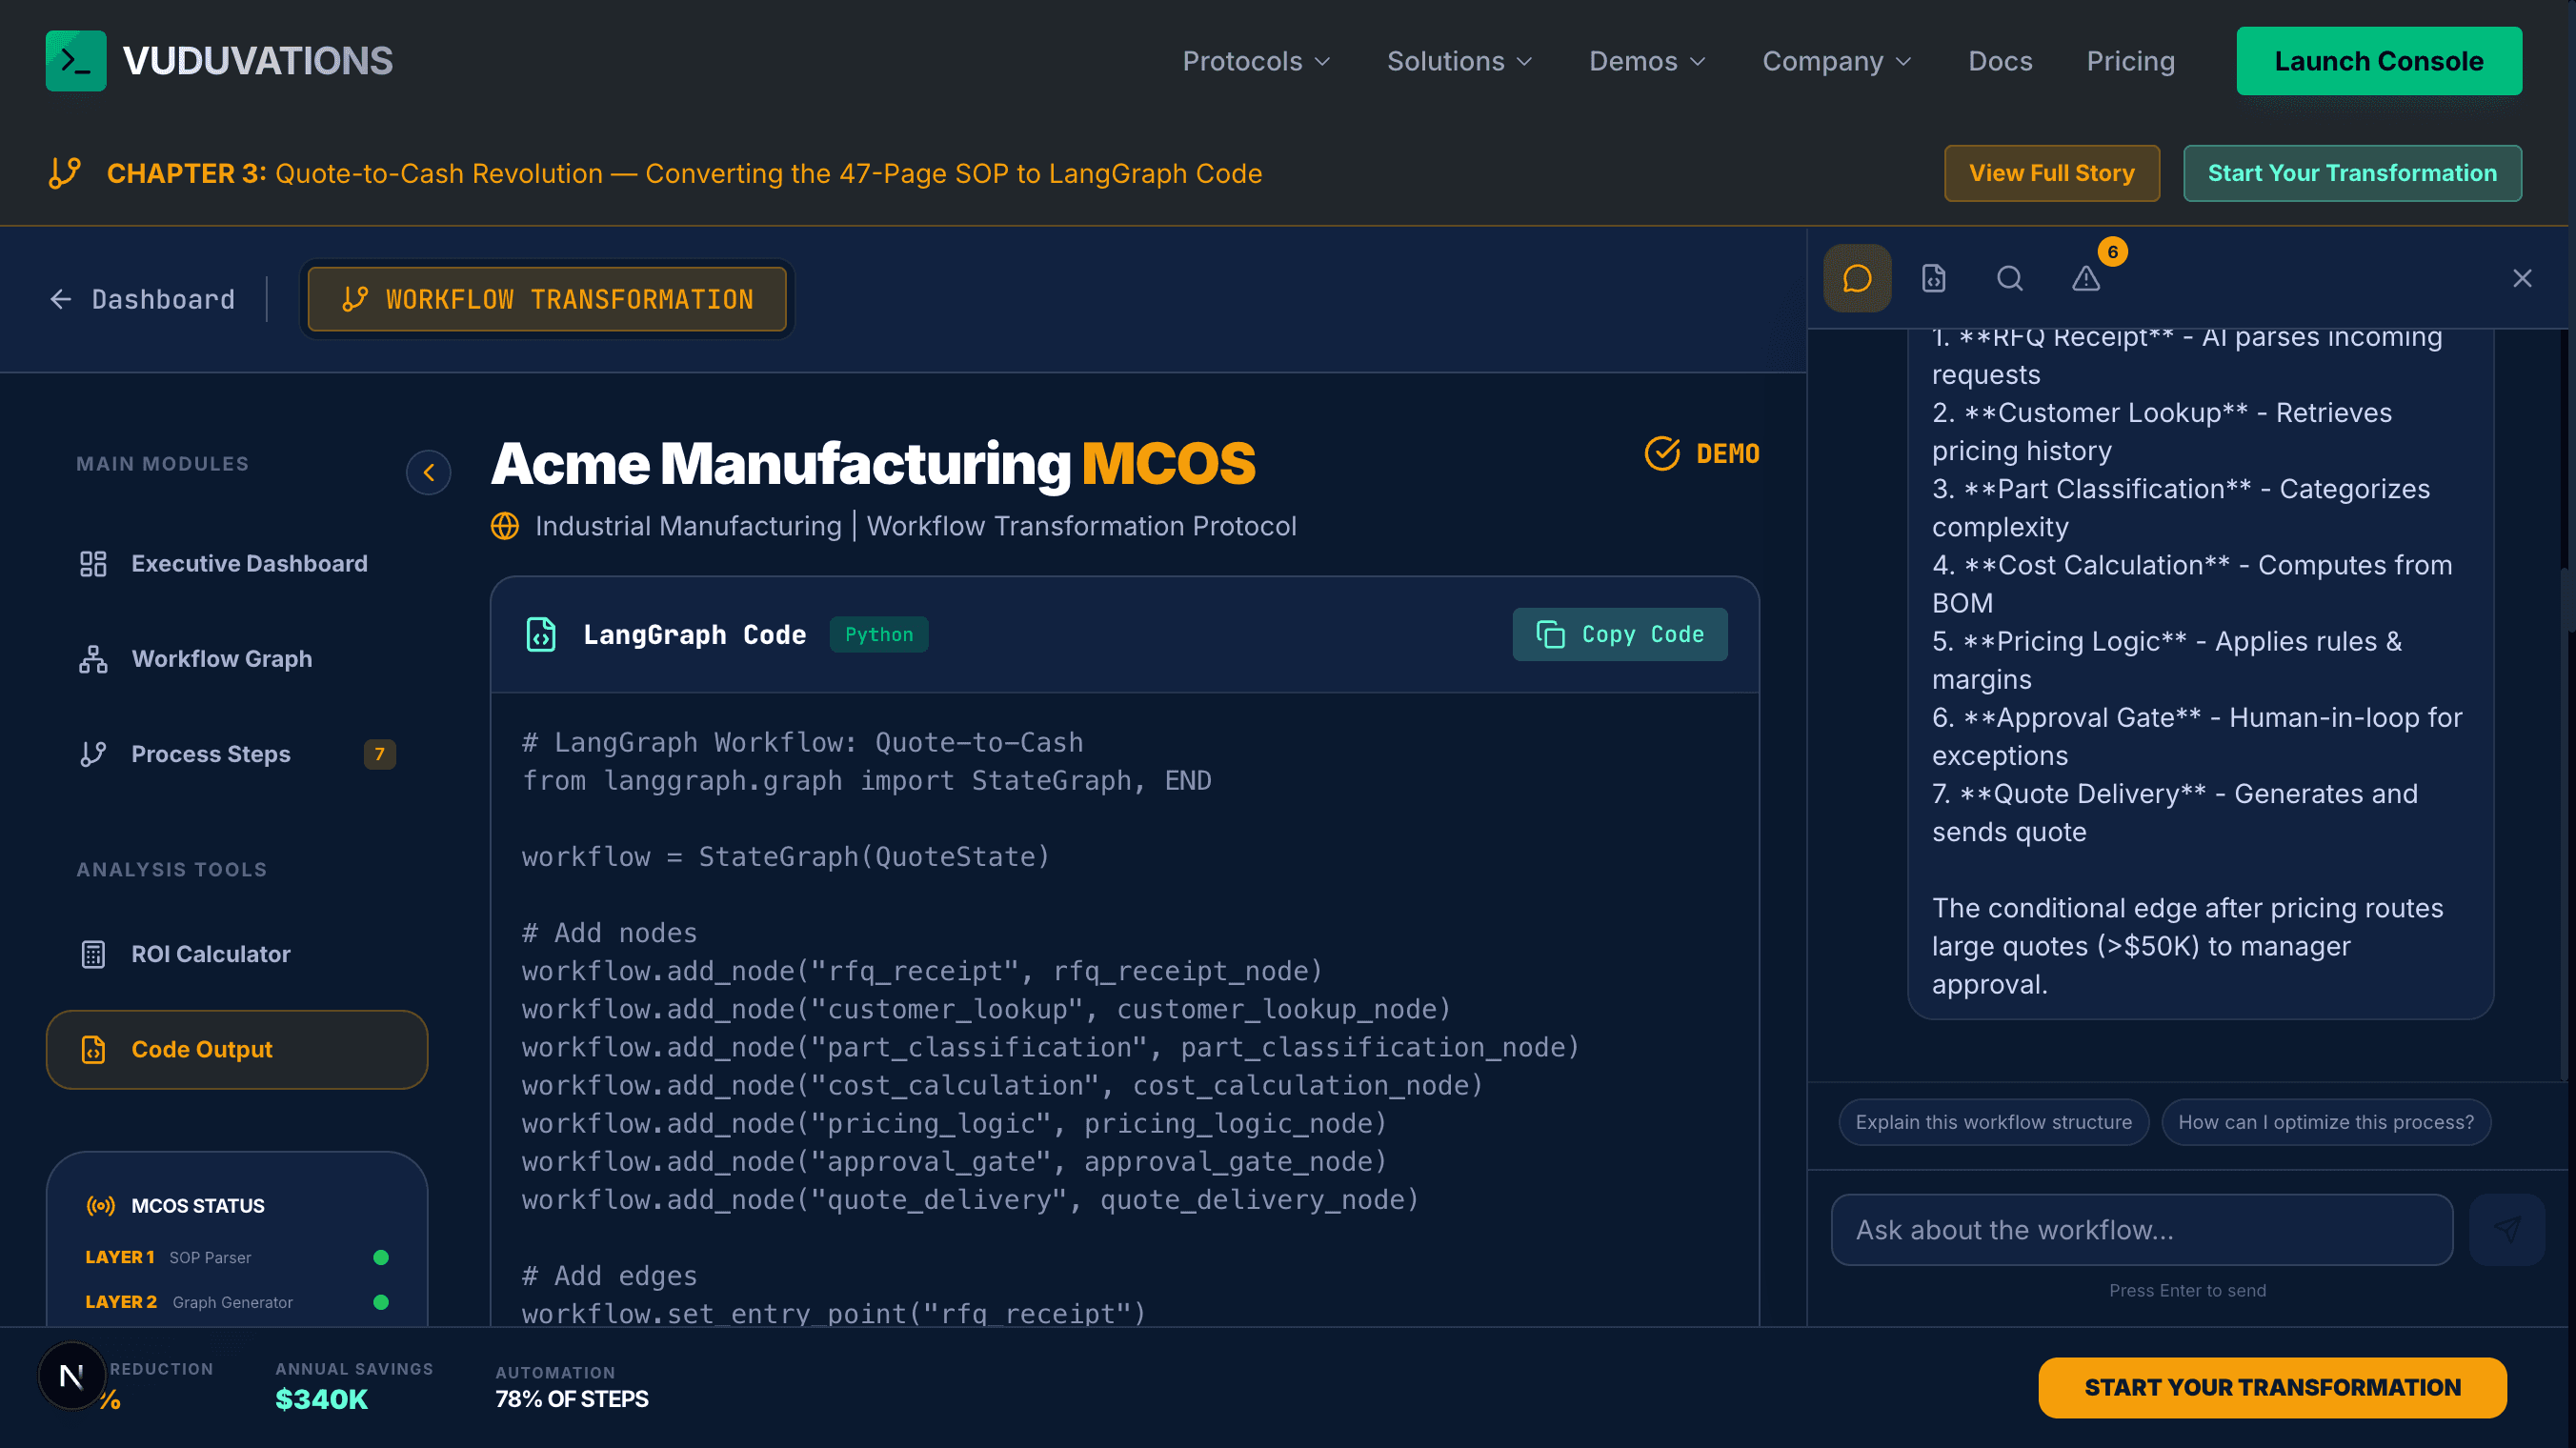
The Workflow Assistant answers questions about your specific workflow.
Suggested Questions (one-click):
Custom Questions — type any question about your workflow:
The assistant has full context of your workflow graph, node details, and transformation data. It can explain specific nodes, suggest optimizations, and walk through decision logic.
Code Tab
The Code tab provides the same LangGraph code view as the Code Output main panel, accessible from the sidebar without switching tabs. Includes the Copy Code button and full syntax-highlighted code.
Inspector Tab
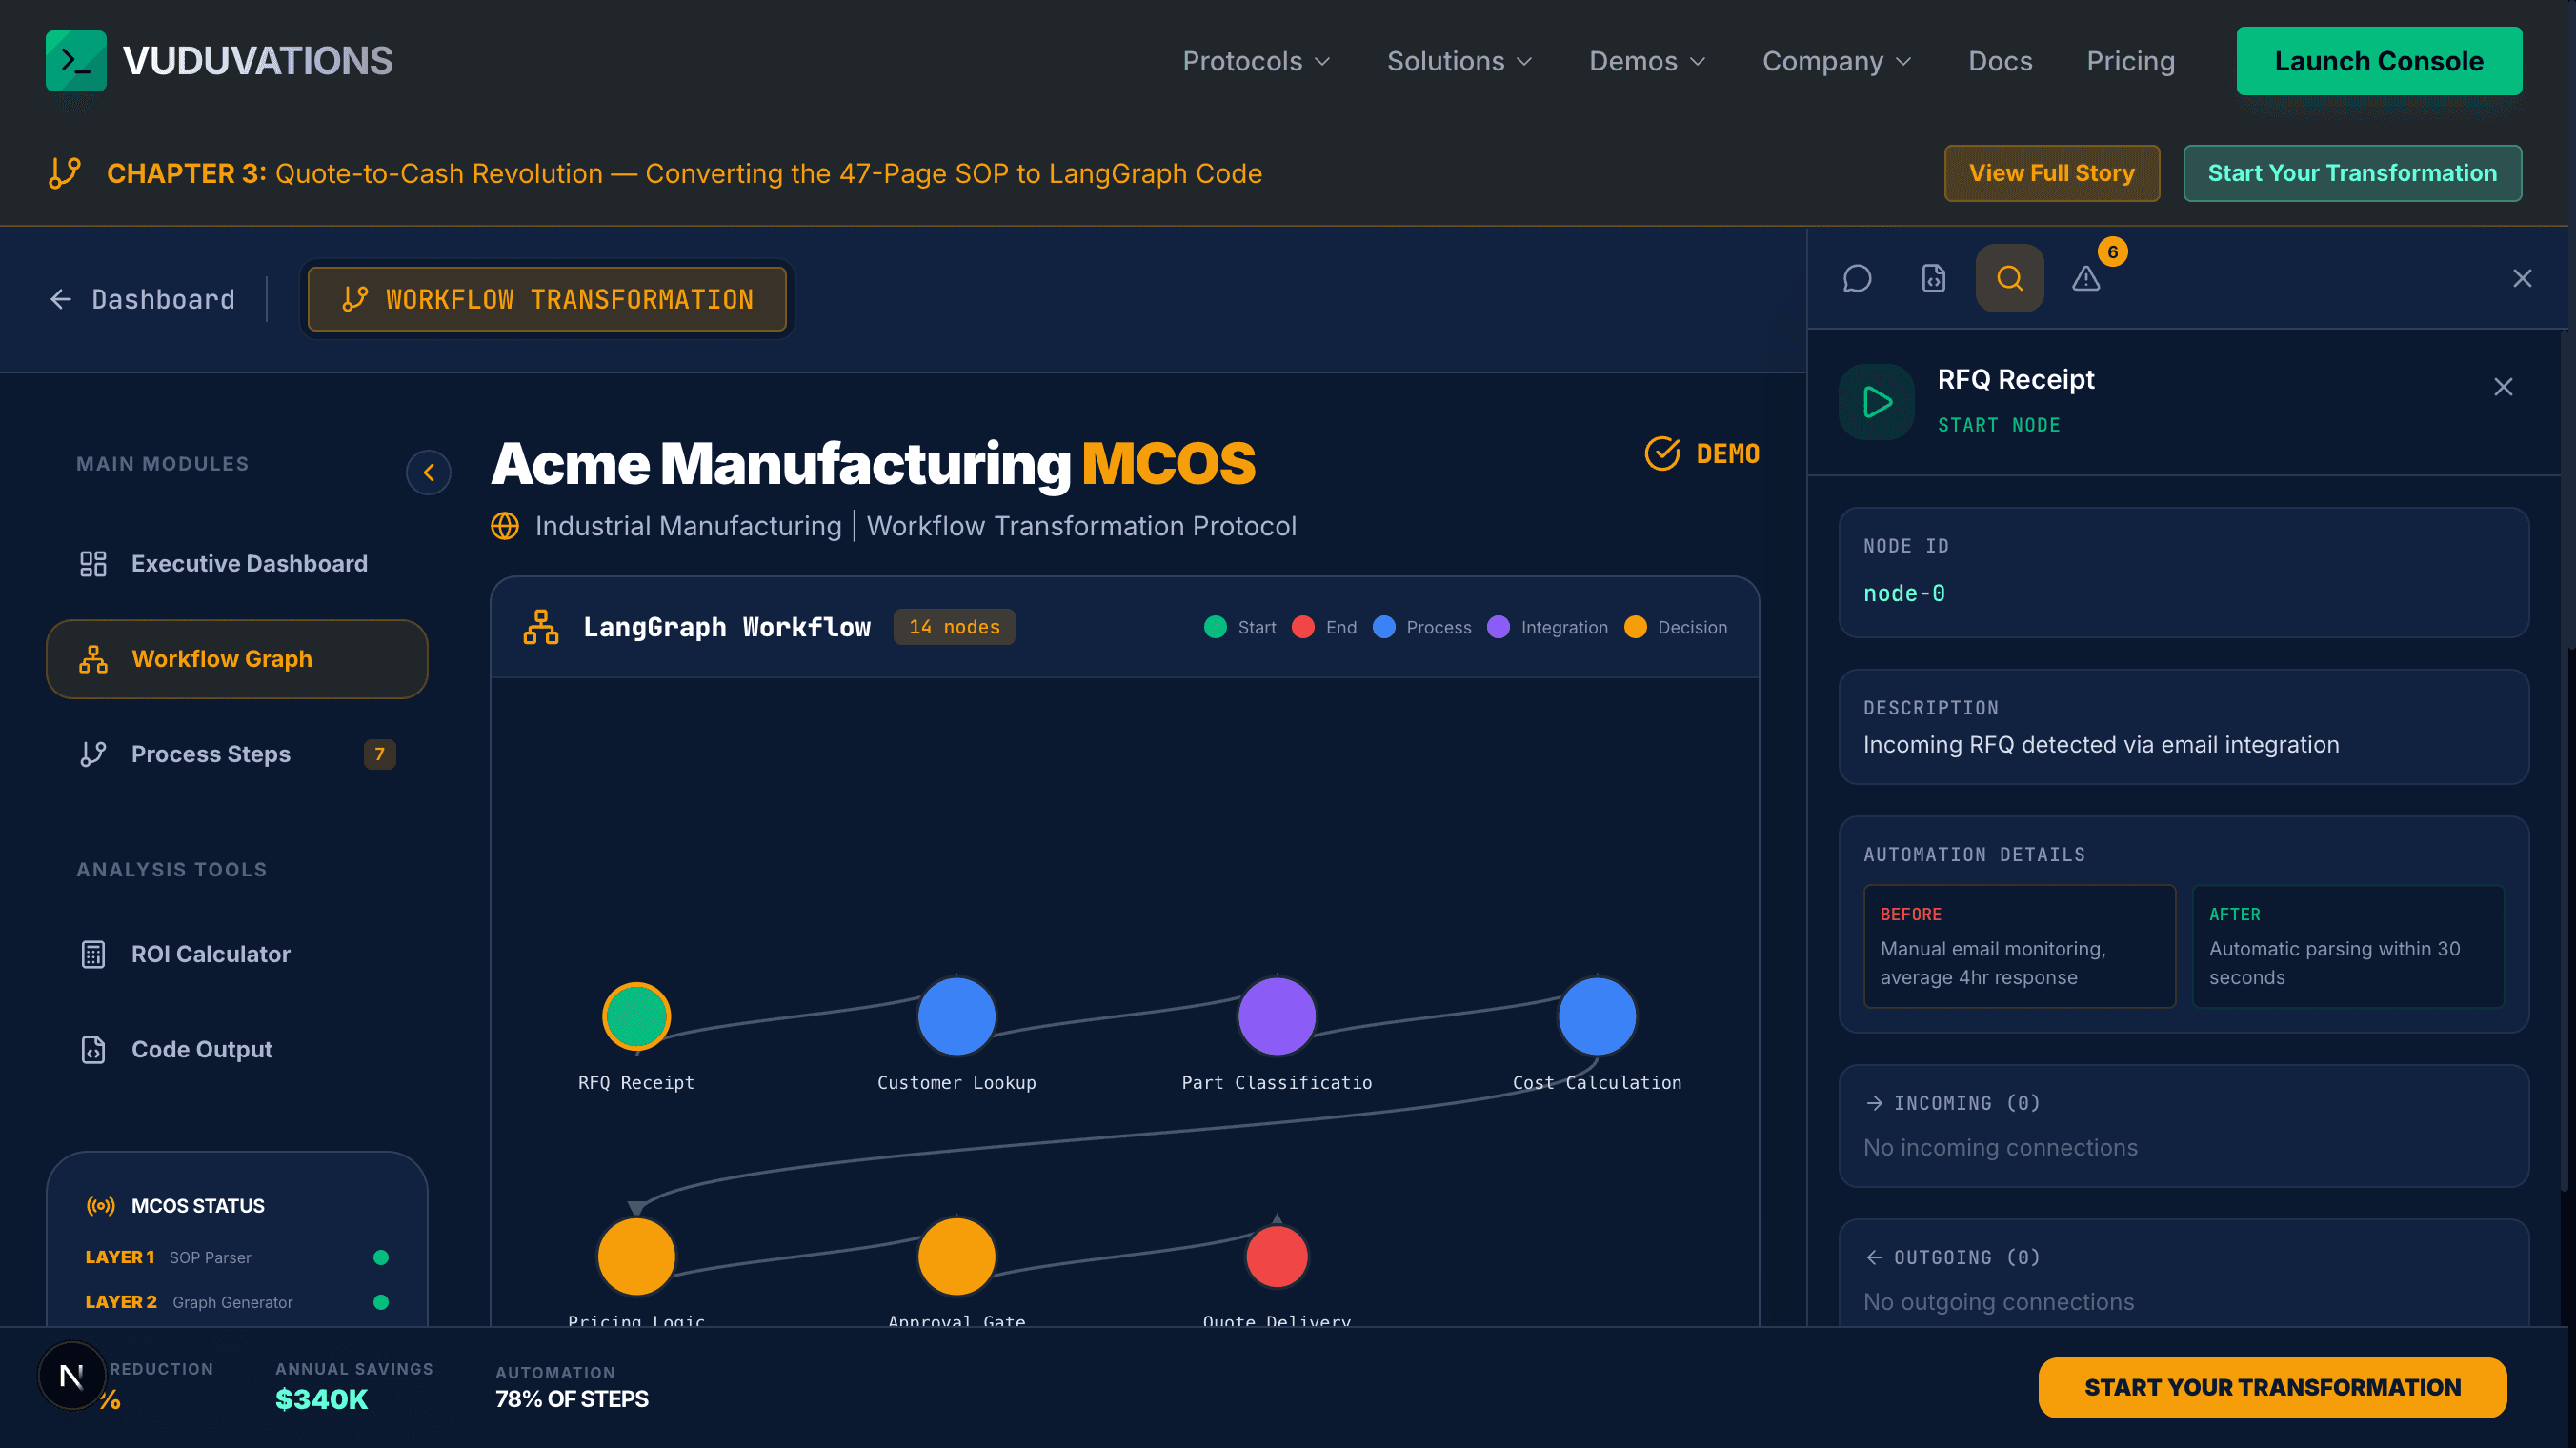
Click any node in the Workflow Graph to open its details in the Inspector.
| Field | Description | Example |
|---|---|---|
| Node Name | Step title | RFQ Receipt |
| Node Type | Type badge (e.g., "START NODE") | START NODE |
| Node ID | Unique identifier | node-0 |
| Description | What this step does | "Parse incoming RFQ and extract key information" |
| Before | Current manual process | "Manual email monitoring, avg 4hr response" |
| After | Automated process | "Automatic parsing within 30 seconds" |
| Incoming Connections | Nodes that feed into this step | (none for start node) |
| Outgoing Connections | Nodes this step feeds into | Customer Lookup |
Validation Tab
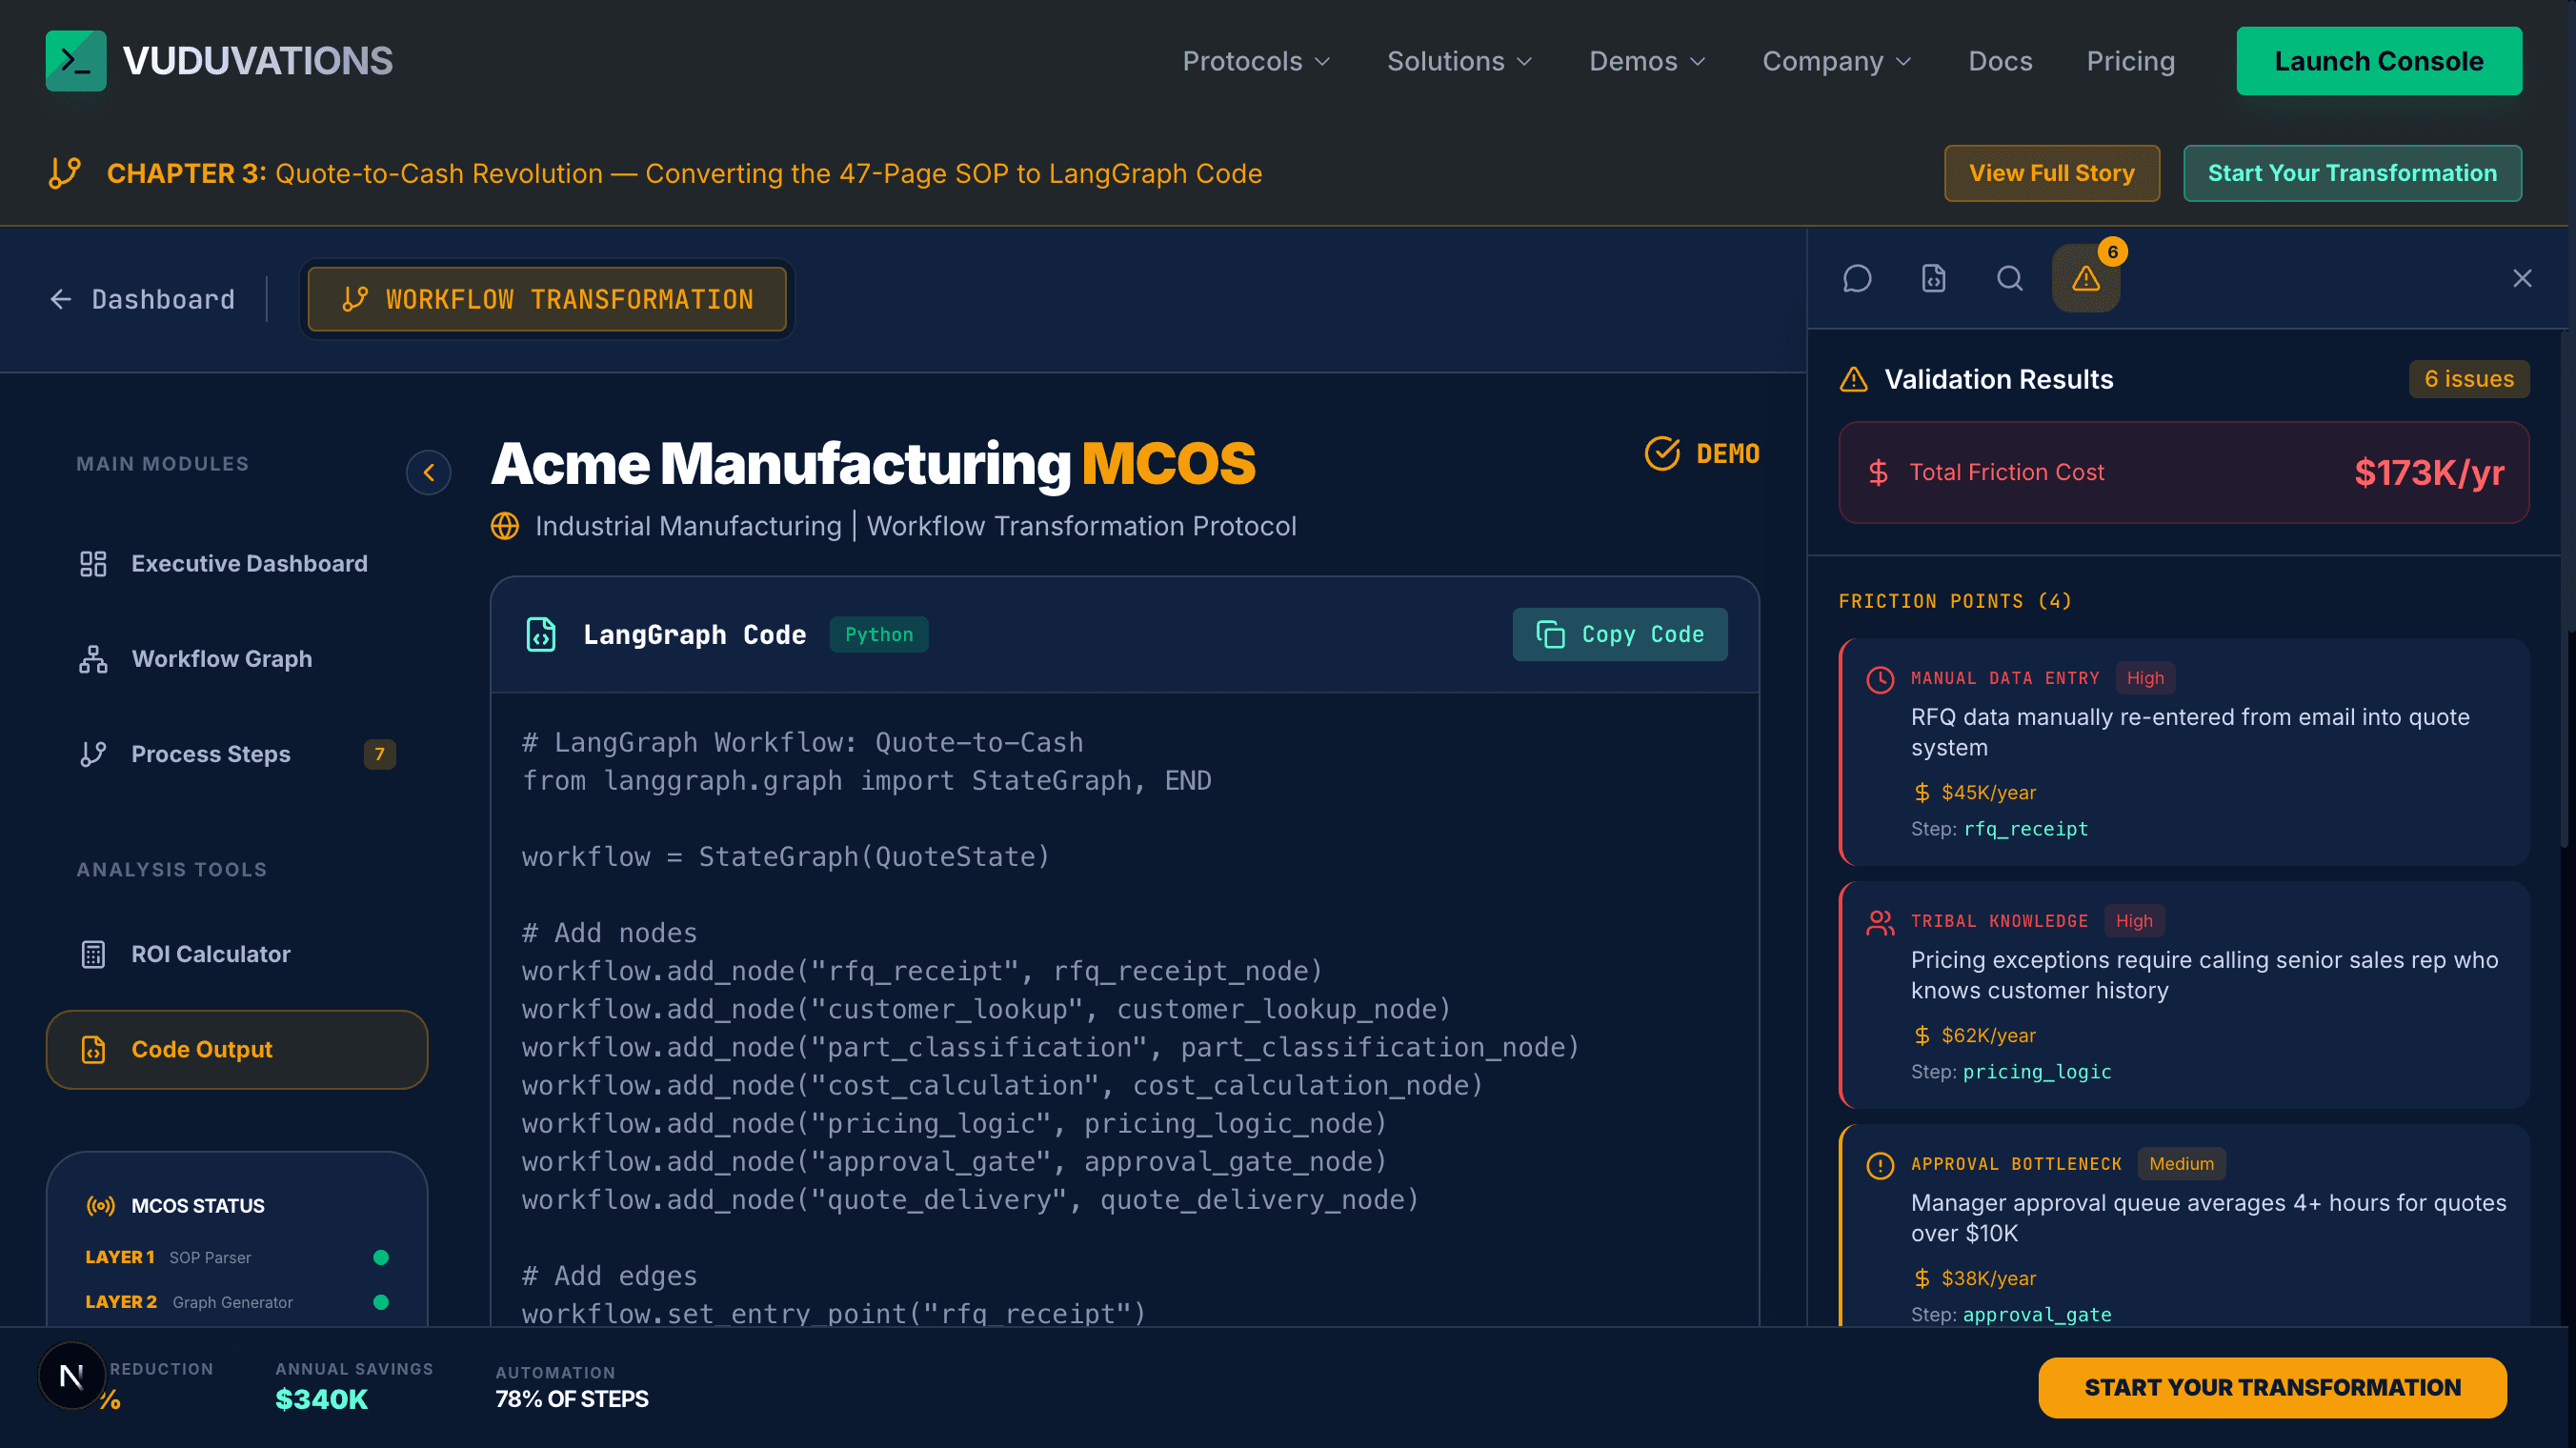
The Validation tab surfaces issues, friction costs, and recommendations. A badge on the tab shows the total issue count (e.g., "6").
Validation Summary:
| Metric | Acme Example |
|---|---|
| Total Issues | 6 |
| Total Friction Cost | $173K/year |
Friction Points (4):
| Friction Type | Severity | Annual Cost | Step |
|---|---|---|---|
| Manual Data Entry | High | $45K/year | rfq_receipt |
| Tribal Knowledge | High | $62K/year | pricing_logic |
| Approval Bottleneck | Medium | $38K/year | approval_gate |
| Redundant Verification | Medium | $28K/year | part_classification |
Warnings (2):
| Warning | Suggestion |
|---|---|
| No fallback path defined for system unavailability | Add error handling nodes for ERP timeout scenarios |
| Customer lookup may return stale data from cache | Implement cache invalidation or real-time sync |
Recommendations:
Key insight: The Validation tab puts a dollar figure on organizational debt. In the Acme example, $173K/year in total friction cost isn't a technology problem — it's a structural one. The "Tribal Knowledge" friction at $62K/year is the same key-person dependency that Key Person Audit scored at 82% and M&A Diligence flagged as the primary deal risk. Workflow Transform quantifies it and produces the fix.
10. Exporting Results
Available Exports
| Export | Format | How to Access |
|---|---|---|
| LangGraph Code | Python (.py) | Copy Code button on Code Output tab or sidebar Code tab |
| BPMN/XML Report | BPMN/XML | Export menu in the header bar |
| Workflow Diagram | SVG / PNG | Export menu — choose vector (SVG) or raster (PNG) |
| JSON | JSON | Structured workflow definition (BIOS subscription required) |
Exporting Code
Exporting the Diagram
Using Exported Code
The exported LangGraph code requires:
langgraph library (pip install langgraph)Deployment options:
11. Best Practices
Getting Better Results
| Do This | Why |
|---|---|
| Include specific timings for each step | Enables accurate ROI calculation |
| Name the systems and tools used | Identifies integration nodes automatically |
| Document decision criteria explicitly | Creates accurate conditional edges |
| Note who performs each step | Distinguishes human-in-loop from automatable steps |
| Include exception handling procedures | Produces complete workflow coverage |
| Mention current error rates and costs | Improves friction cost estimates |
SOP Improvement Tips Before Analysis
Common Pitfalls
| Avoid This | What Happens |
|---|---|
| Vague step descriptions ("process the order") | Generic nodes with no automation details |
| Missing decision logic | Incomplete graph with no conditional edges |
| No system or tool names | Integration nodes cannot be identified |
| Undocumented exceptions | Workflow lacks error handling paths |
| No timing data | ROI estimates default to rough benchmarks |
| Single-person perspective | Misses steps handled by other roles |
Implementing the Workflow
Interpreting Your Results
| If You See... | What It Really Means |
|---|---|
| High Tribal Knowledge friction | This is organizational debt — knowledge trapped in one person that should be infrastructure. Encode it before that person leaves or the business sells. |
| Low Automation Rate (<50%) | The process needs re-architecture, not just automation. You can't automate a broken workflow — you need to redesign it. |
| Many Decision Points | Complex processes benefit most from clear conditional routing — and expose the most hidden dependencies |
| High Approval Bottleneck cost | One person as a gatekeeper is a structural chokepoint. Implement tiered auto-approval with escalation thresholds. |
| Payback > 12 months | Phase the implementation — start with the highest-friction nodes, not the easiest ones |
Quick Reference
Dashboard Layout
| Area | Component | What It Does |
|---|---|---|
| Top Banner | Chapter Context | Story context with links to full story and transformation page |
| Left Sidebar | Module Navigation | Switch between Executive Dashboard, Workflow Graph, Process Steps, ROI Calculator, Code Output |
| Left Sidebar | MCOS Status | Shows Layer 1-4 processing status (green = complete, amber = active) |
| Left Sidebar | SOP Analysis | Quick stats: pages, steps, current time, target time |
| Main Content | Active Module | The selected module's full view |
| Right Sidebar | Chat / Code / Inspector / Validation tabs | Interactive exploration tools |
| Bottom Bar | Persistent Stats | Time reduction, annual savings, automation rate always visible |
Node Type Guide
| Node Type | Color | When Used | Acme Example |
|---|---|---|---|
| Start | Green | Process entry point | RFQ Receipt |
| End | Red | Process completion | Quote Delivery |
| Process | Blue | Standard processing step | Cost Calculation |
| Integration | Purple | External system connection | Part Classification |
| Decision | Amber | Conditional branch point | Pricing Logic, Approval Gate |
Sidebar Tabs
| Tab | Badge | Purpose |
|---|---|---|
| Validation | Issue count (e.g., "6") | Friction points with costs, warnings, and recommendations |
Friction Type Resolution Guide
| Friction Type | Typical Cost | Solution |
|---|---|---|
| Manual Data Entry | $30K-60K/yr | AI parsing, form automation, API extraction |
| Tribal Knowledge | $40K-80K/yr | Rule encoding, decision tables, knowledge capture |
| Approval Bottleneck | $20K-50K/yr | Tiered auto-approval, parallel routing, threshold-based escalation |
| Redundant Verification | $15K-40K/yr | Single source of truth, automated validation, system integration |
Automation Potential by Step Type
| Current Step | Automated Version | Impact |
|---|---|---|
| Manual email monitoring | AI email parsing + webhook trigger | Minutes to seconds |
| Database lookups by hand | API integration with caching | Minutes to instant |
| Expert visual inspection | Computer vision classification | 30 min to 10 sec |
| Spreadsheet calculations | Real-time API pricing engine | 1 hour to 5 sec |
| One-person decision making | Encoded rules + exception routing | Hours to instant |
| Manual document generation | Template engine + auto-send | 20 min to instant |
Related Documentation
Need help? Contact [email protected]
Need help? Contact [email protected].