
M&A Diligence
Version: 1.1
Last Updated: July 30, 2026
The M&A Diligence protocol analyzes due diligence materials and management interviews to assess acquisition risks, identify deal breakers, quantify synergies, structure deal terms, and generate investment recommendations with evidence-backed confidence scores.
Table of Contents
1. What M&A Diligence Does
Purpose
M&A Diligence answers the critical question: "Should we do this deal, and what risks should we know about?"
Unlike traditional diligence checklists, the M&A protocol cross-references findings across multiple data sources — financial records, management interviews, operational assessments, and prior VuduVations analyses — to build a complete risk picture with quantified value creation opportunities.
It identifies:
Who Should Use It
| User Type | Use Case |
|---|---|
| M&A Teams | Target assessment and deal structuring |
| Private Equity | Investment due diligence and value creation planning |
| Corporate Development | Acquisition evaluation and integration planning |
| Investment Banks | Deal advisory and investment memos |
| Strategic Buyers | Fit assessment and synergy analysis |
What You'll Get
| Output | Description |
|---|---|
| Deal Structure | Enterprise value, multiples, deal type, timeline |
| Due Diligence Assessment | 6-area assessment with risk levels and completion tracking |
| Diligence Scorecard | Overall score with 5 key metrics |
| Risk Matrix | Risks ranked by impact and probability |
| Value Creation Thesis | Quantified initiatives with total upside |
| Deal Terms | Purchase price, earnout gates, deal structure |
| Recommendation | Proceed/Conditional/No-Go with confidence score |
| Findings | Positive indicators and areas to monitor |
2. Preparing Your Input
Ideal Input: Management Presentations & Interviews
The best input combines management presentations with interview transcripts.
| Input Type | What It Provides |
|---|---|
| CIM (Confidential Information Memorandum) | Company overview, financials |
| Management interviews | Strategic insights, culture, candid assessments |
| Financial statements | Numbers verification, margin analysis |
| Customer/supplier data | Concentration risks, retention rates |
| Org charts | People dependencies, succession gaps |
Interview Guide Template
For management interviews, cover:
Business Model (15 min):
Operations (15 min):
Risks (15 min):
Synergies (10 min):
Input Quality Checklist
Good Input:
Weak Input:
Tip: The M&A protocol produces the richest results when it can cross-reference findings from other VuduVations protocols. Running Key Person Audit and Sales Intel on the same target first provides the M&A protocol with dependency scores, deal intelligence, and operational data to inform its assessment.
3. Running an Analysis
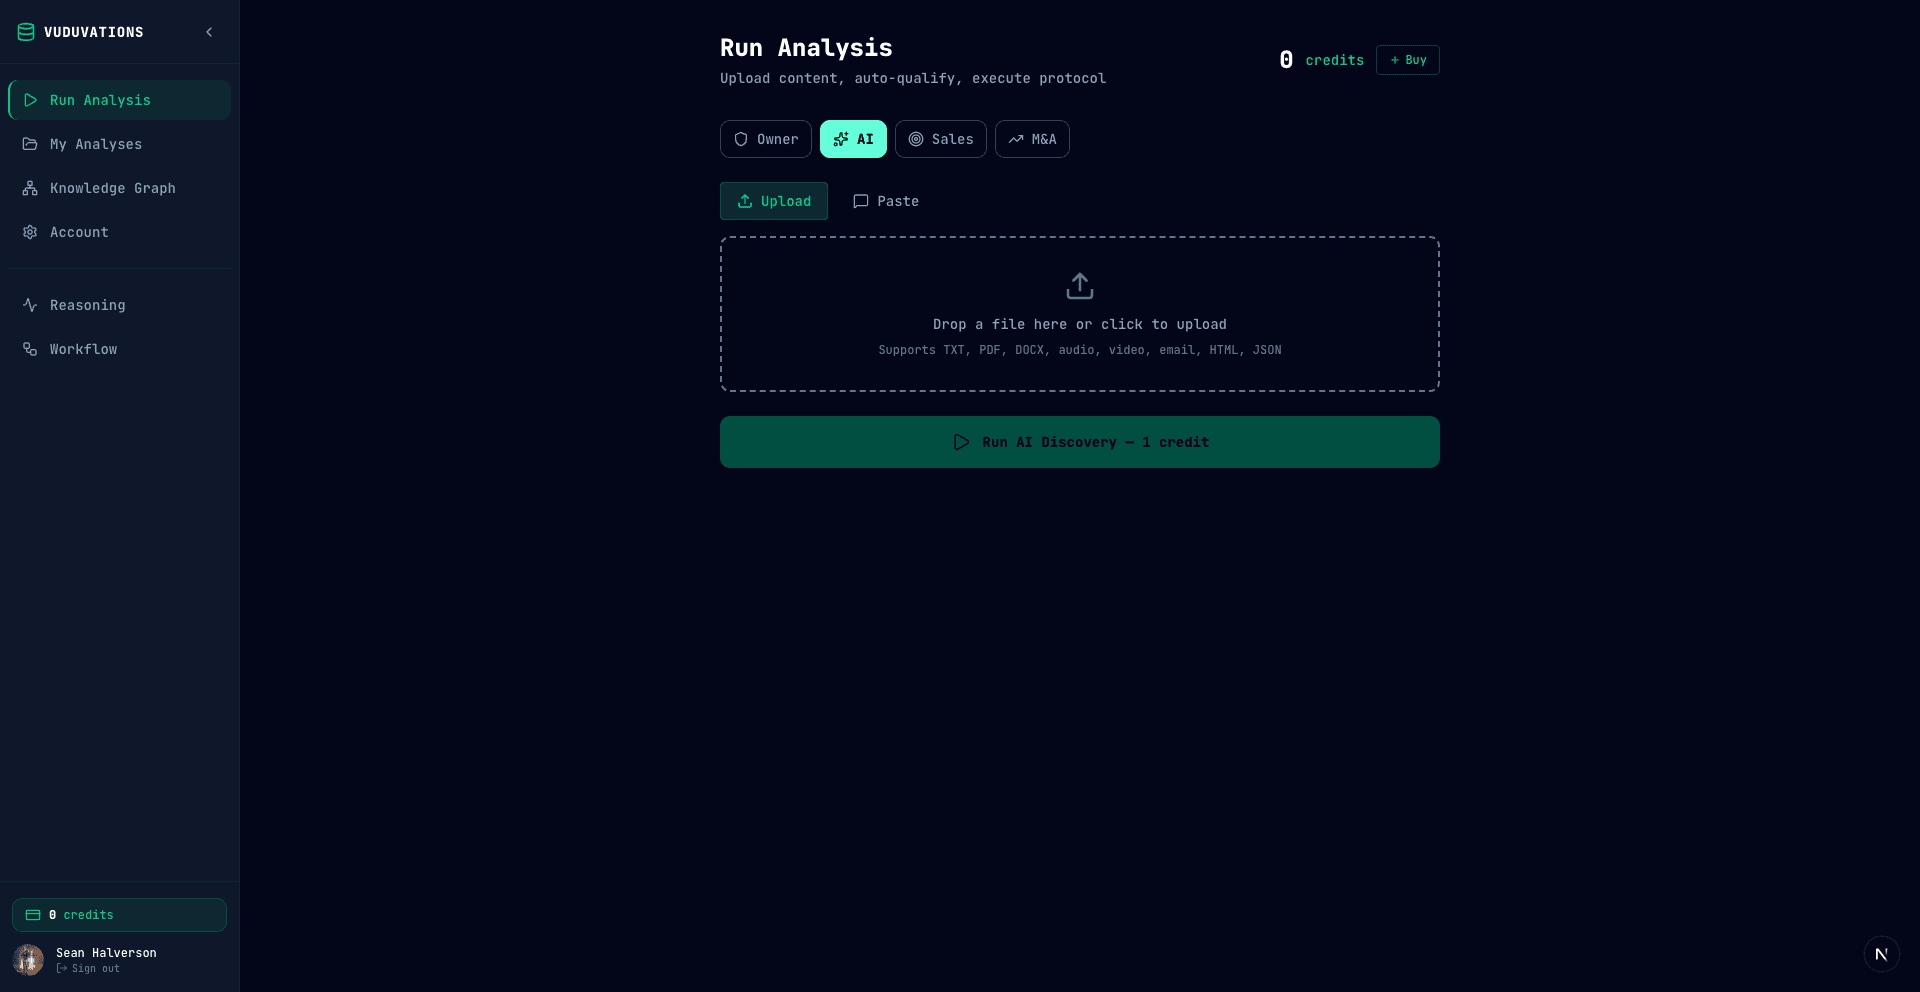
Step 1: Access M&A Diligence
From the Run Analysis page, click the M&A protocol tab.
Step 2: Upload Your Input
Upload documents and/or transcripts:
Step 3: Run Analysis
4. Deal Overview & Structure
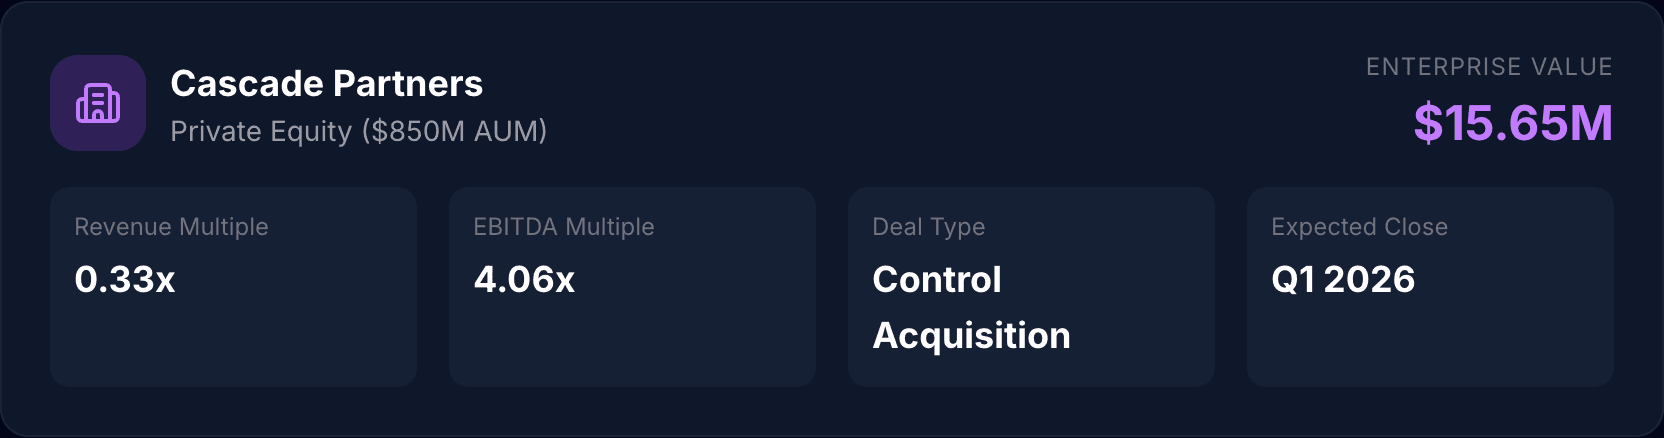
The M&A results begin with a deal overview showing the acquirer profile and key deal metrics.
Acquirer Profile
| Field | Example |
|---|---|
| Acquirer | Cascade Partners |
| Type | Private Equity ($850M AUM) |
| Enterprise Value | $15.65M |
Deal Metrics
| Metric | Value | What It Means |
|---|---|---|
| Revenue Multiple | 0.33x | Price relative to revenue |
| EBITDA Multiple | 4.06x | Price relative to earnings |
| Deal Type | Control Acquisition | Full ownership transfer |
| Expected Close | Q1 2026 | Target closing timeline |
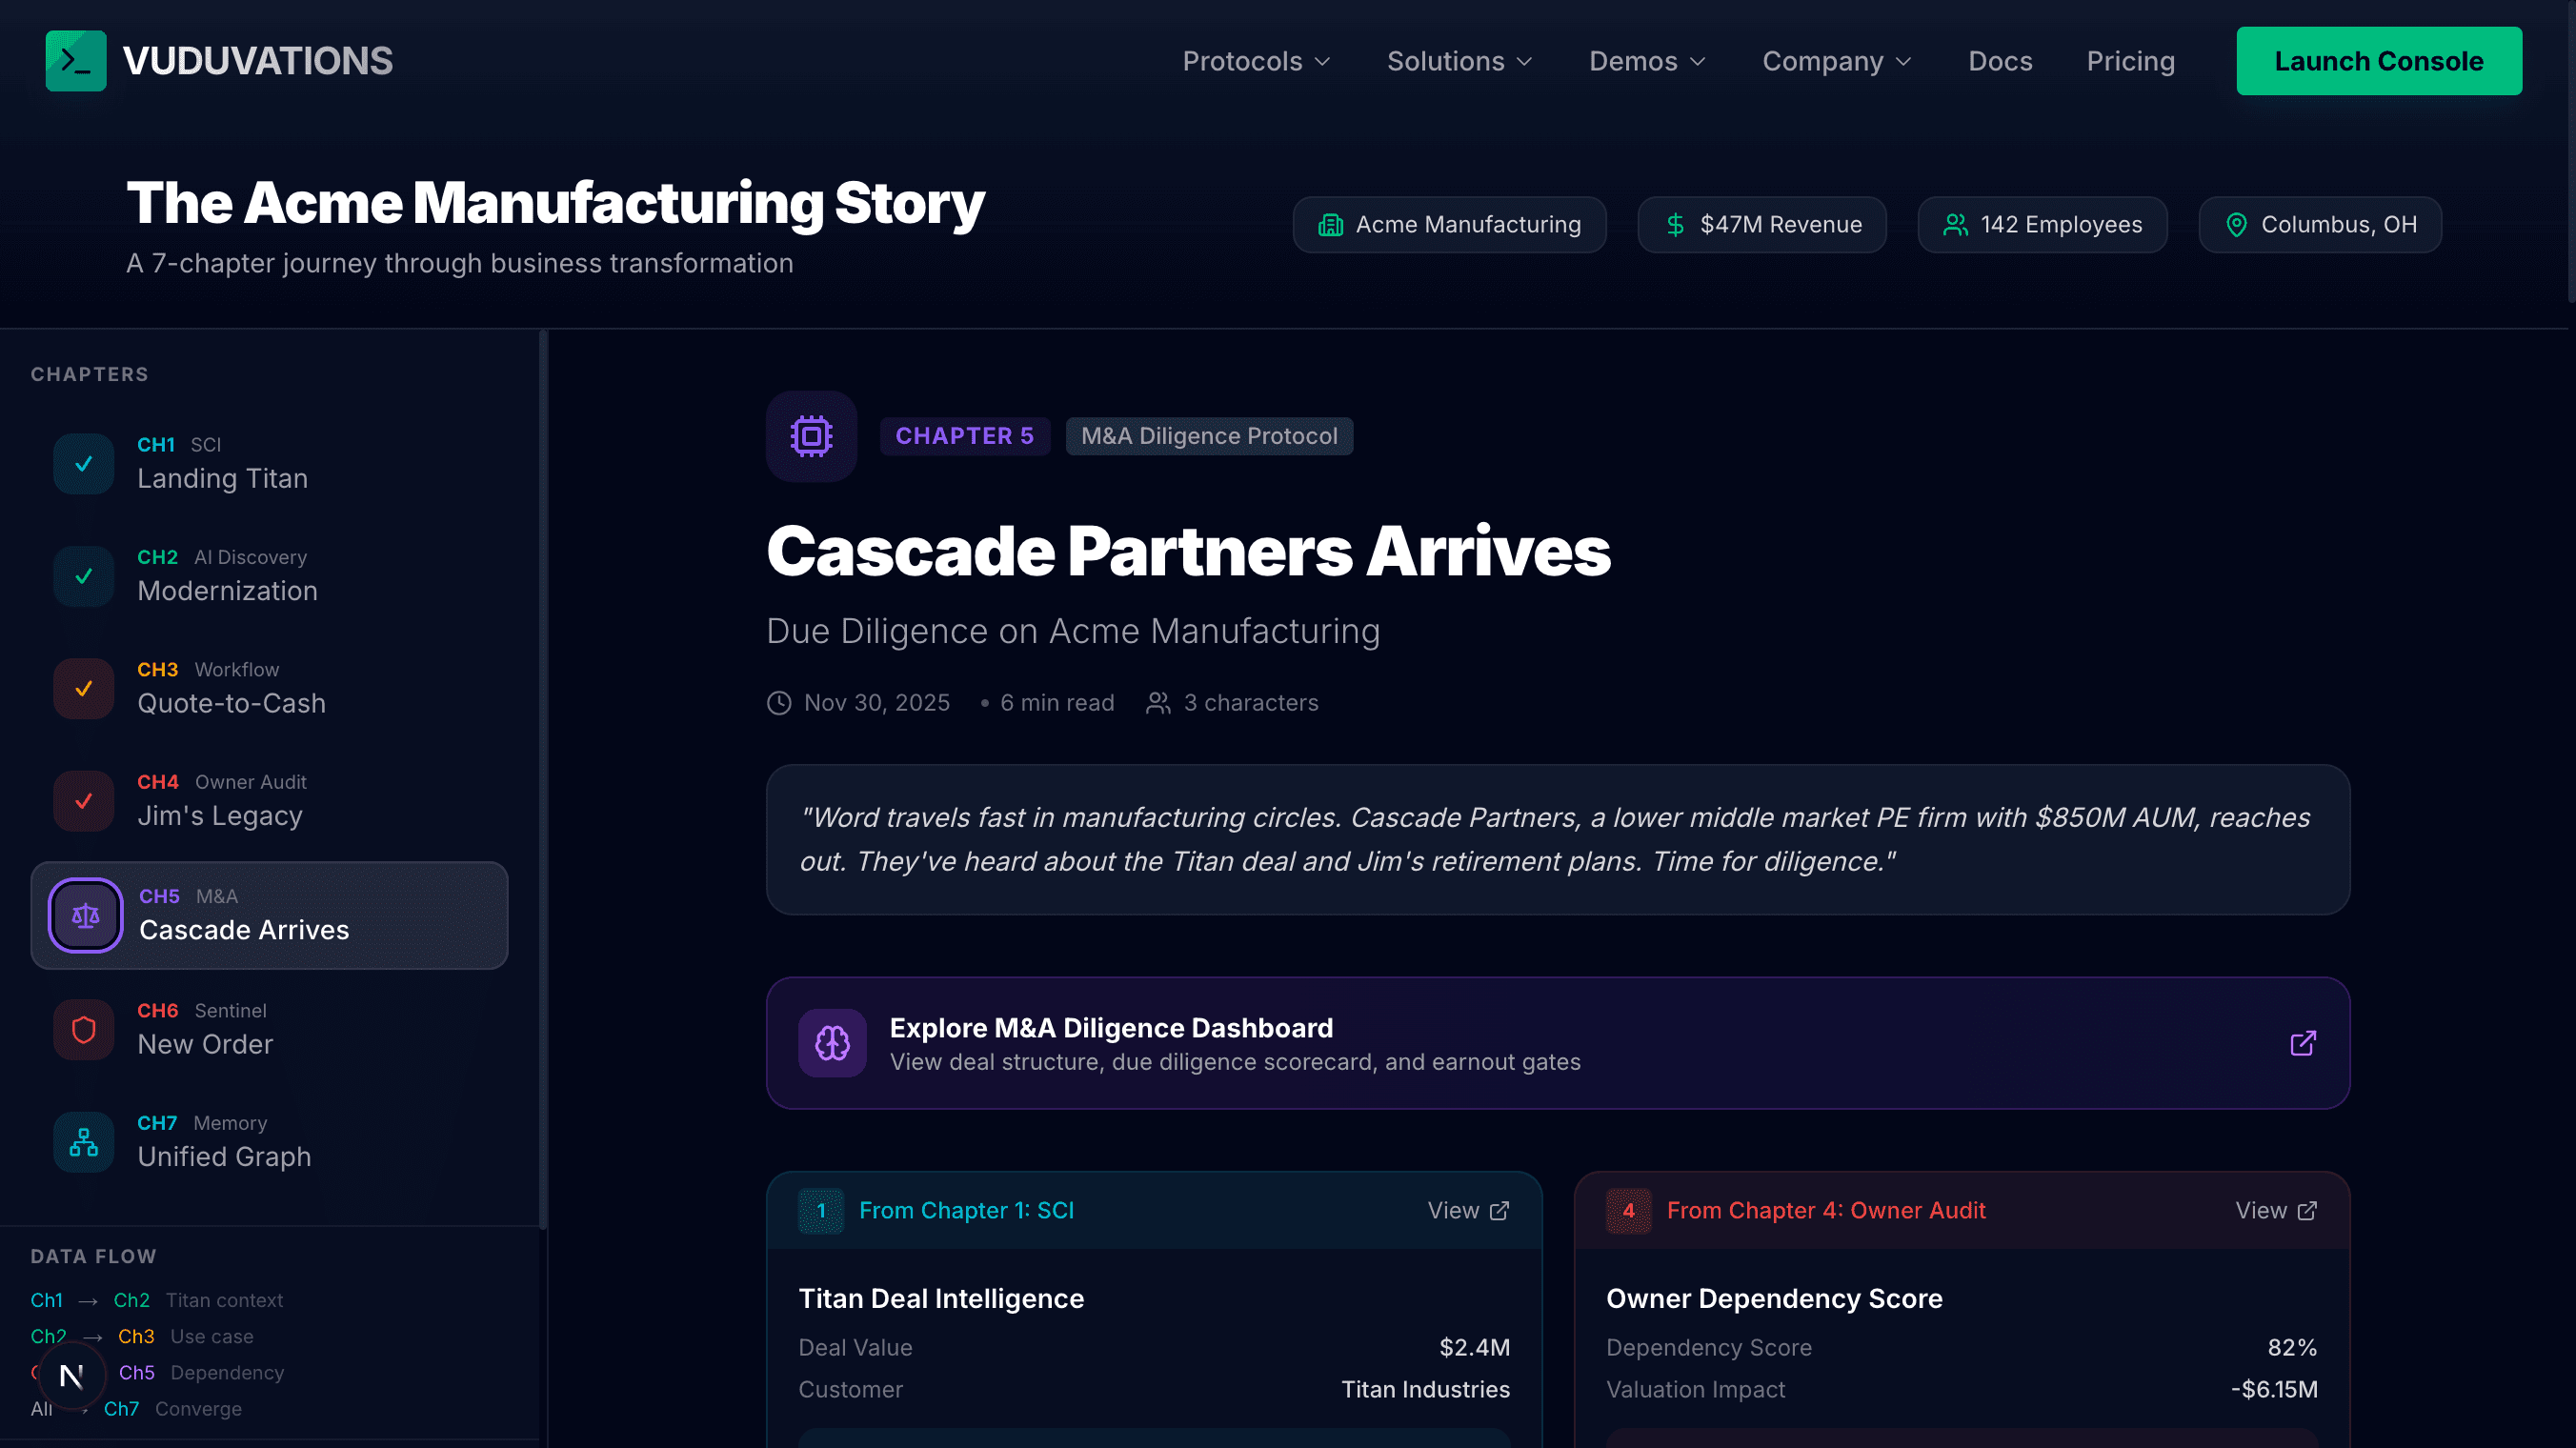
Cross-Reference Intelligence
The M&A protocol pulls findings from prior VuduVations analyses on the same target:
| Source | Finding | Relevance |
|---|---|---|
| Sales Intel (Ch.1) | $2.4M Titan deal, 17% revenue concentration | Demonstrates sales capability and customer quality |
| Key Person Audit (Ch.4) | 82% dependency score, -$6.15M valuation impact | Critical risk requiring earnout structure |
5. Due Diligence Assessment
The Due Diligence Assessment evaluates the target across 6 key areas, each with a risk level and completion percentage.
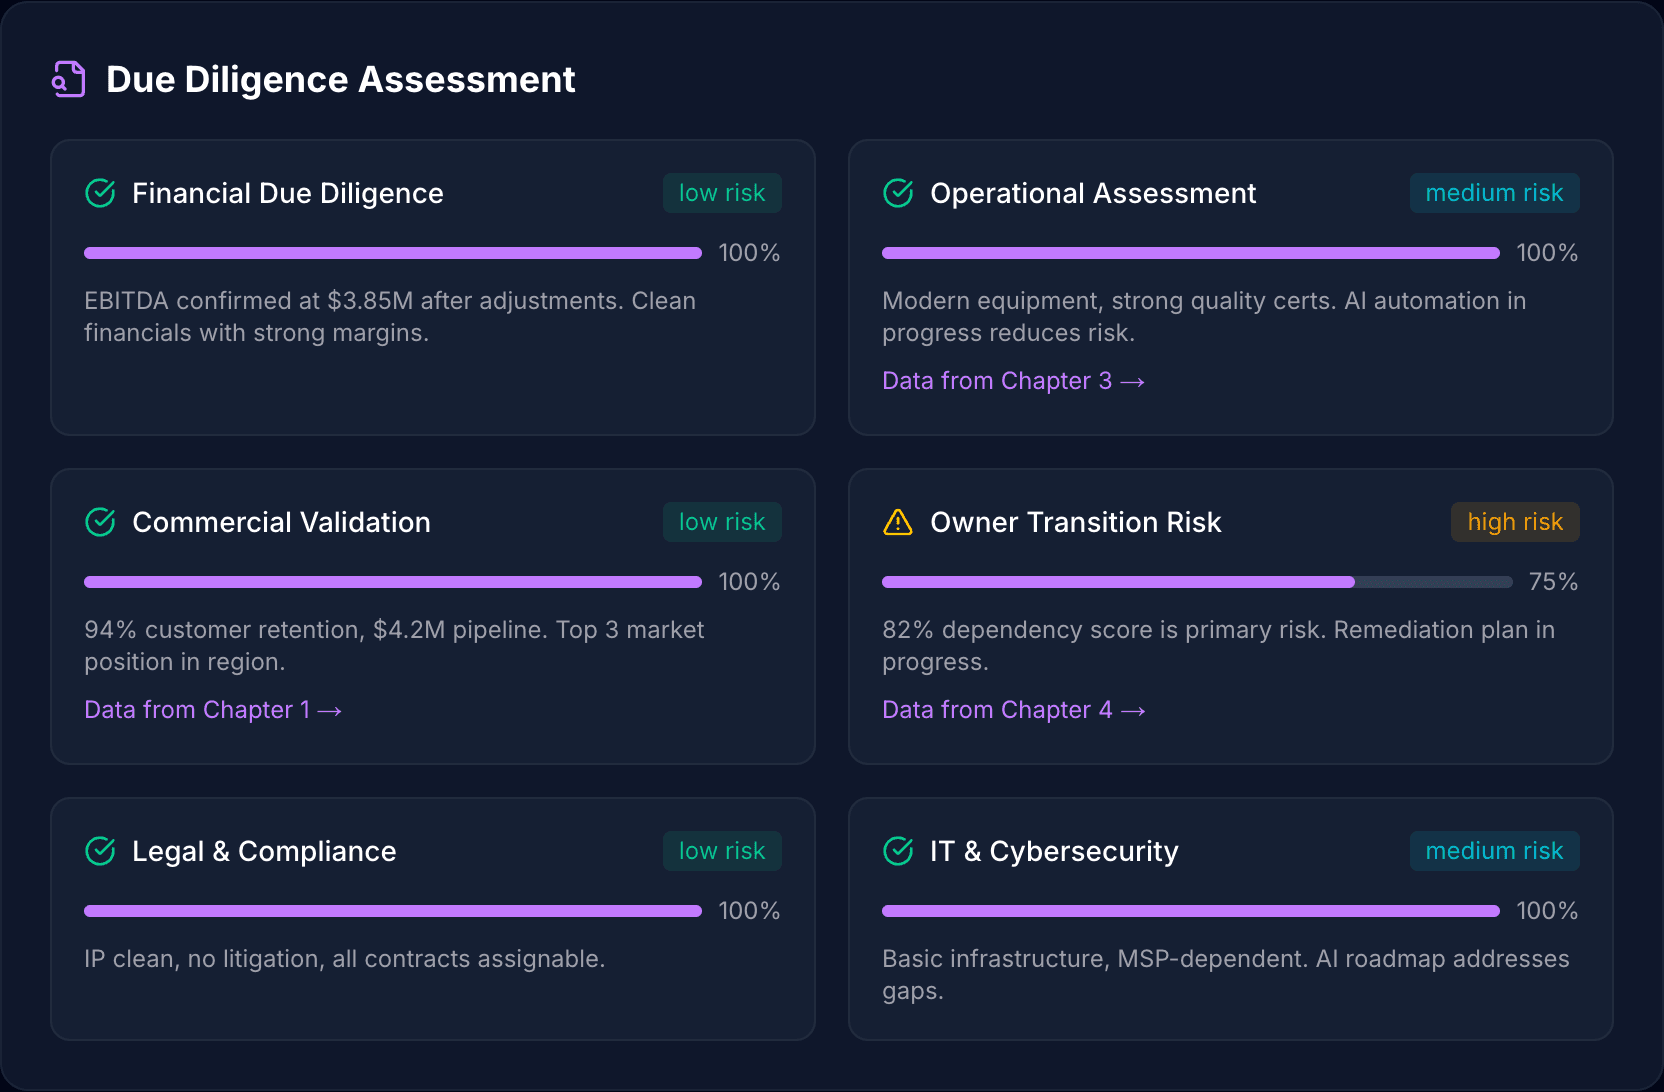
Assessment Areas
| Area | Risk Level | Completion | Key Finding |
|---|---|---|---|
| Financial Due Diligence | Low | 100% | EBITDA confirmed at $3.85M after adjustments. Clean financials with strong margins |
| Operational Assessment | Medium | 100% | Modern equipment, strong quality certs. AI automation in progress reduces risk |
| Commercial Validation | Low | 100% | 94% customer retention, $4.2M pipeline. Top 3 market position in region |
| Owner Transition Risk | High | 75% | 82% dependency score is primary risk. Remediation plan in progress |
| Legal & Compliance | Low | 100% | IP clean, no litigation, all contracts assignable |
| IT & Cybersecurity | Medium | 100% | Basic infrastructure, MSP-dependent. AI roadmap addresses gaps |
Risk Level Guide
| Level | Color | Meaning |
|---|---|---|
| Low | Green | Standard diligence, no concerns |
| Medium | Yellow | Manageable risks, plan needed |
| High | Red | Significant risk requiring mitigation |
Each assessment area links back to the VuduVations protocol that generated its data (e.g., "Data from Chapter 3" for operational findings from Workflow Transform).
6. Due Diligence Scorecard
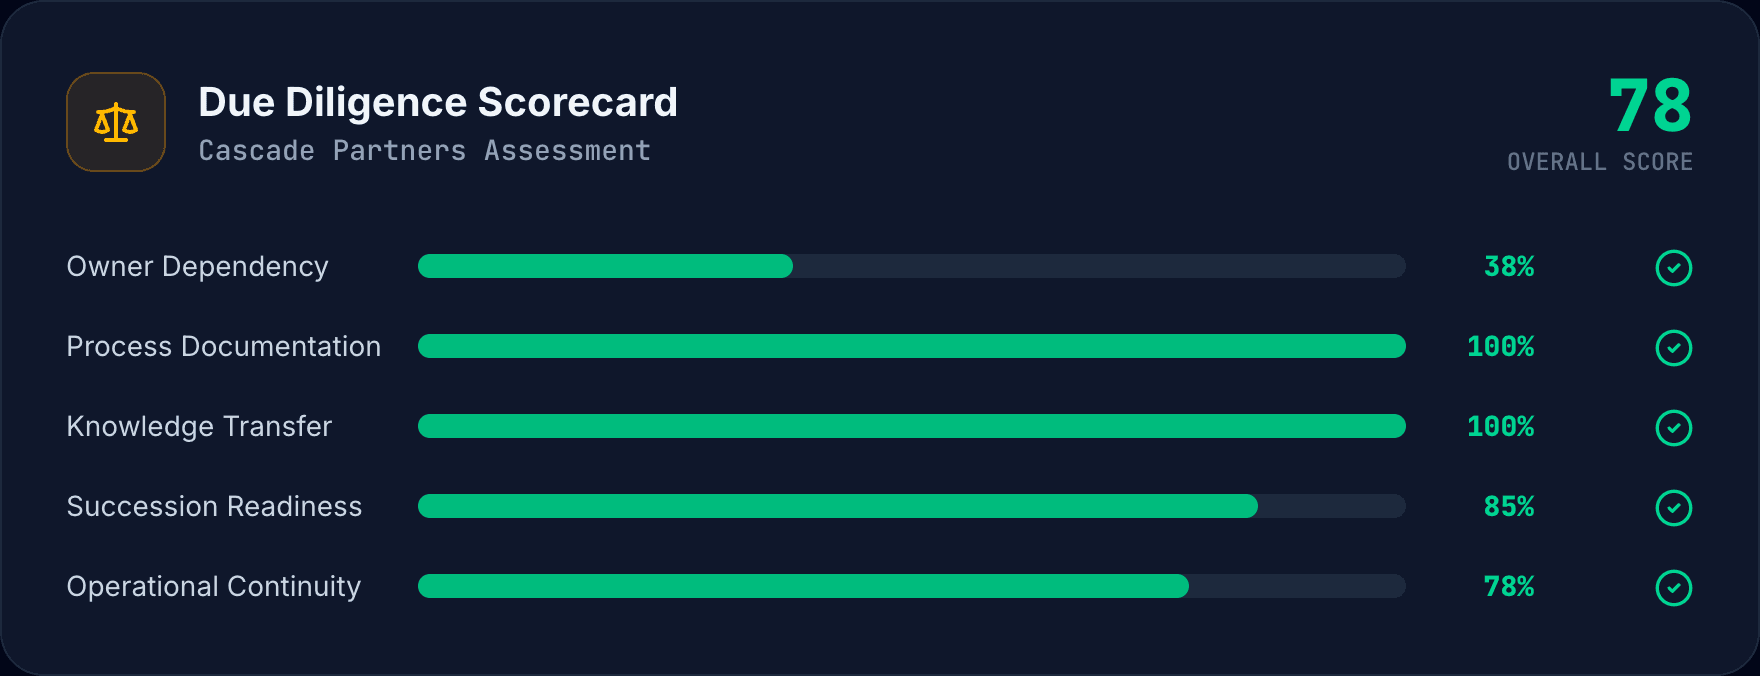
The Diligence Scorecard provides a single overall score with breakdown across 5 key metrics, used by the buyer to assess deal readiness.
Overall Score
The scorecard displays a 0-100 overall score (higher is better — measures deal readiness, not risk).
Scorecard Metrics
| Metric | Score | What It Measures |
|---|---|---|
| Owner Dependency | 38% | How dependent the business is on the current owner (lower is better) |
| Process Documentation | 100% | Percentage of critical processes documented |
| Knowledge Transfer | 100% | Percentage of knowledge items successfully transferred |
| Succession Readiness | 85% | Readiness of the successor to take over |
| Operational Continuity | 78% | Ability of business to operate without disruption post-close |
Tip: The scorecard is what PE buyers use to justify their valuation. An overall score above 75 typically supports full asking price; below 60 triggers earnout structures or price reductions.
7. Risk Matrix
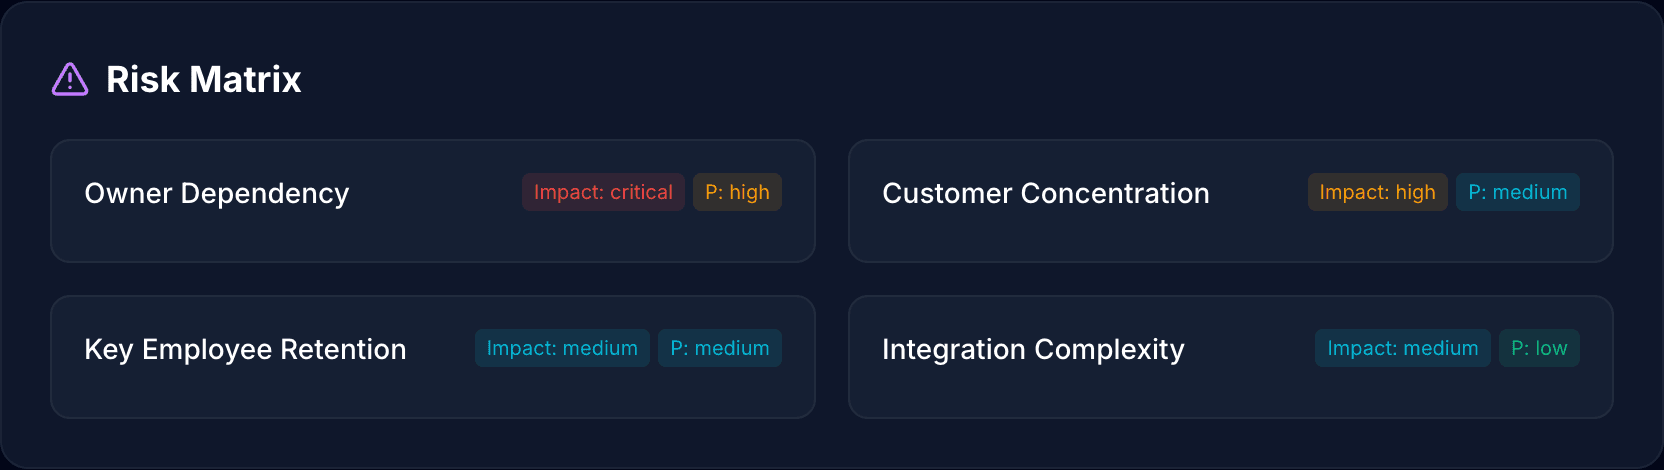
The Risk Matrix identifies and ranks all material risks by impact severity and probability.
Identified Risks
| Risk | Impact | Probability | Mitigation |
|---|---|---|---|
| Owner Dependency | Critical | High | Earnout gates tied to dependency reduction milestones |
| Customer Concentration | High | Medium | Revenue diversification plan, pipeline development |
| Key Employee Retention | Medium | Medium | Retention packages, succession planning |
| Integration Complexity | Medium | Low | Phased integration plan, dedicated PMO |
How to Read the Matrix
8. Value Creation Thesis
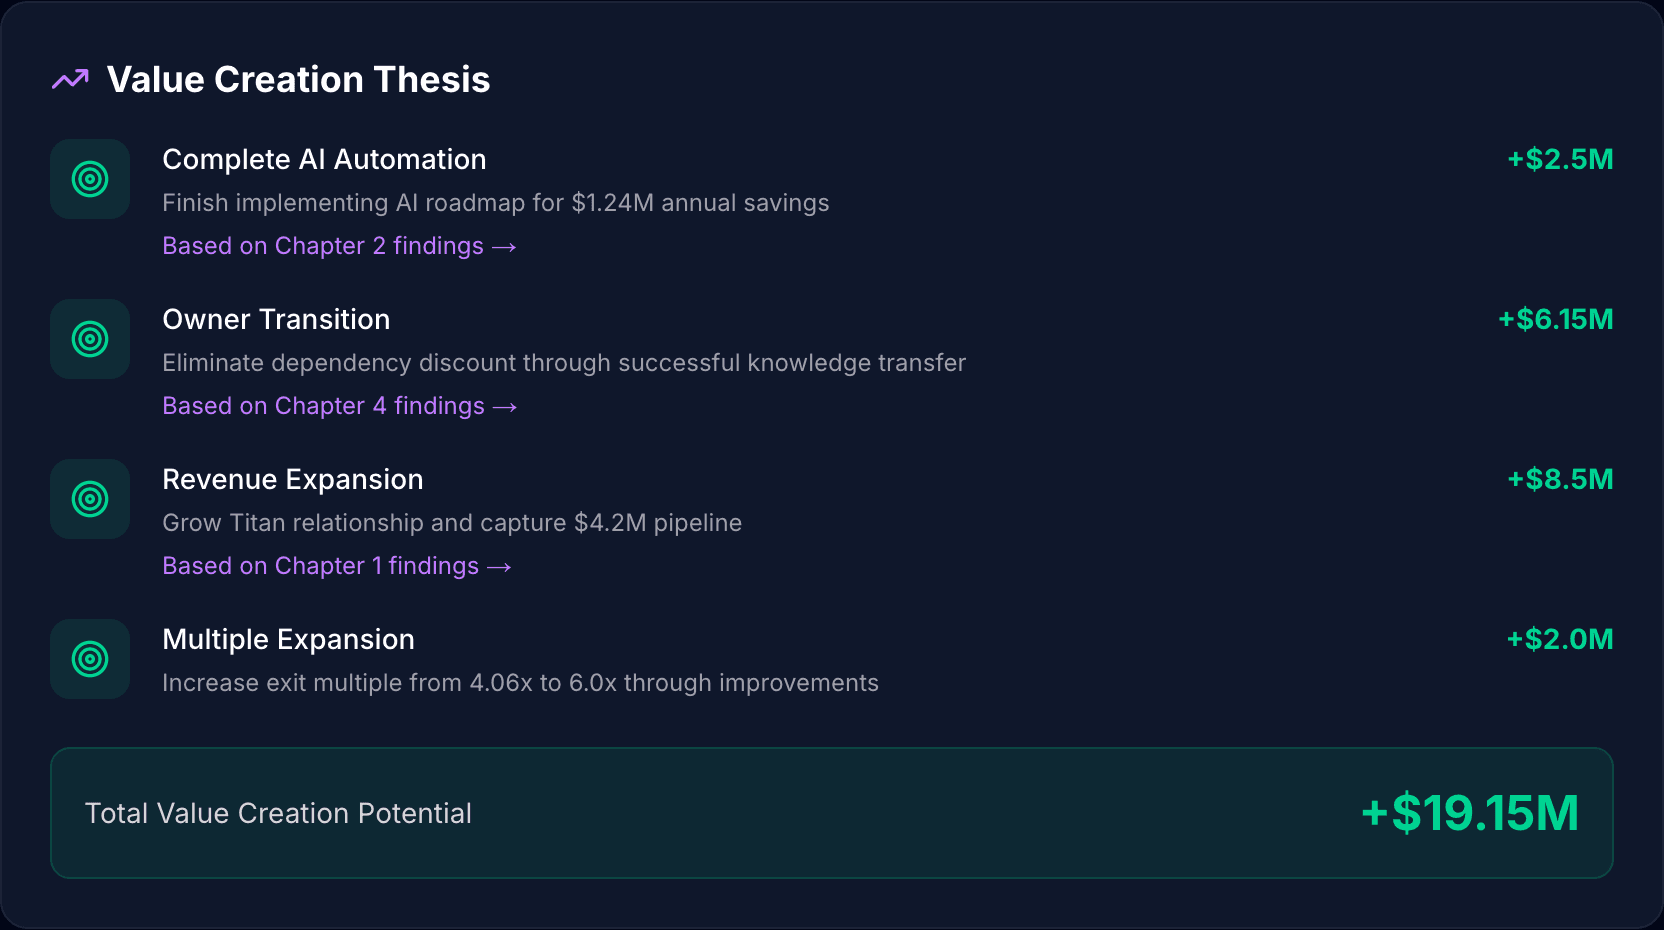
The Value Creation Thesis quantifies the upside potential, showing specific initiatives with dollar values and cross-references to supporting data.
Value Creation Initiatives
| Initiative | Value Add | Description | Source |
|---|---|---|---|
| Complete AI Automation | +$2.5M | Finish implementing AI roadmap for $1.24M annual savings | AI Discovery (Ch.2) |
| Owner Transition | +$6.15M | Eliminate dependency discount through successful knowledge transfer | Key Person Audit (Ch.4) |
| Revenue Expansion | +$8.5M | Grow Titan relationship and capture $4.2M pipeline | Sales Intel (Ch.1) |
| Multiple Expansion | +$2.0M | Increase exit multiple from 4.06x to 6.0x through improvements | M&A Analysis |
Total Value Creation Potential: **+$19.15M**
Why this matters: The value creation thesis is what PE firms present to their investment committee. Each initiative traces back to evidence from prior VuduVations analyses, making the case data-backed rather than aspirational.
9. Deal Terms & Earnout Gates
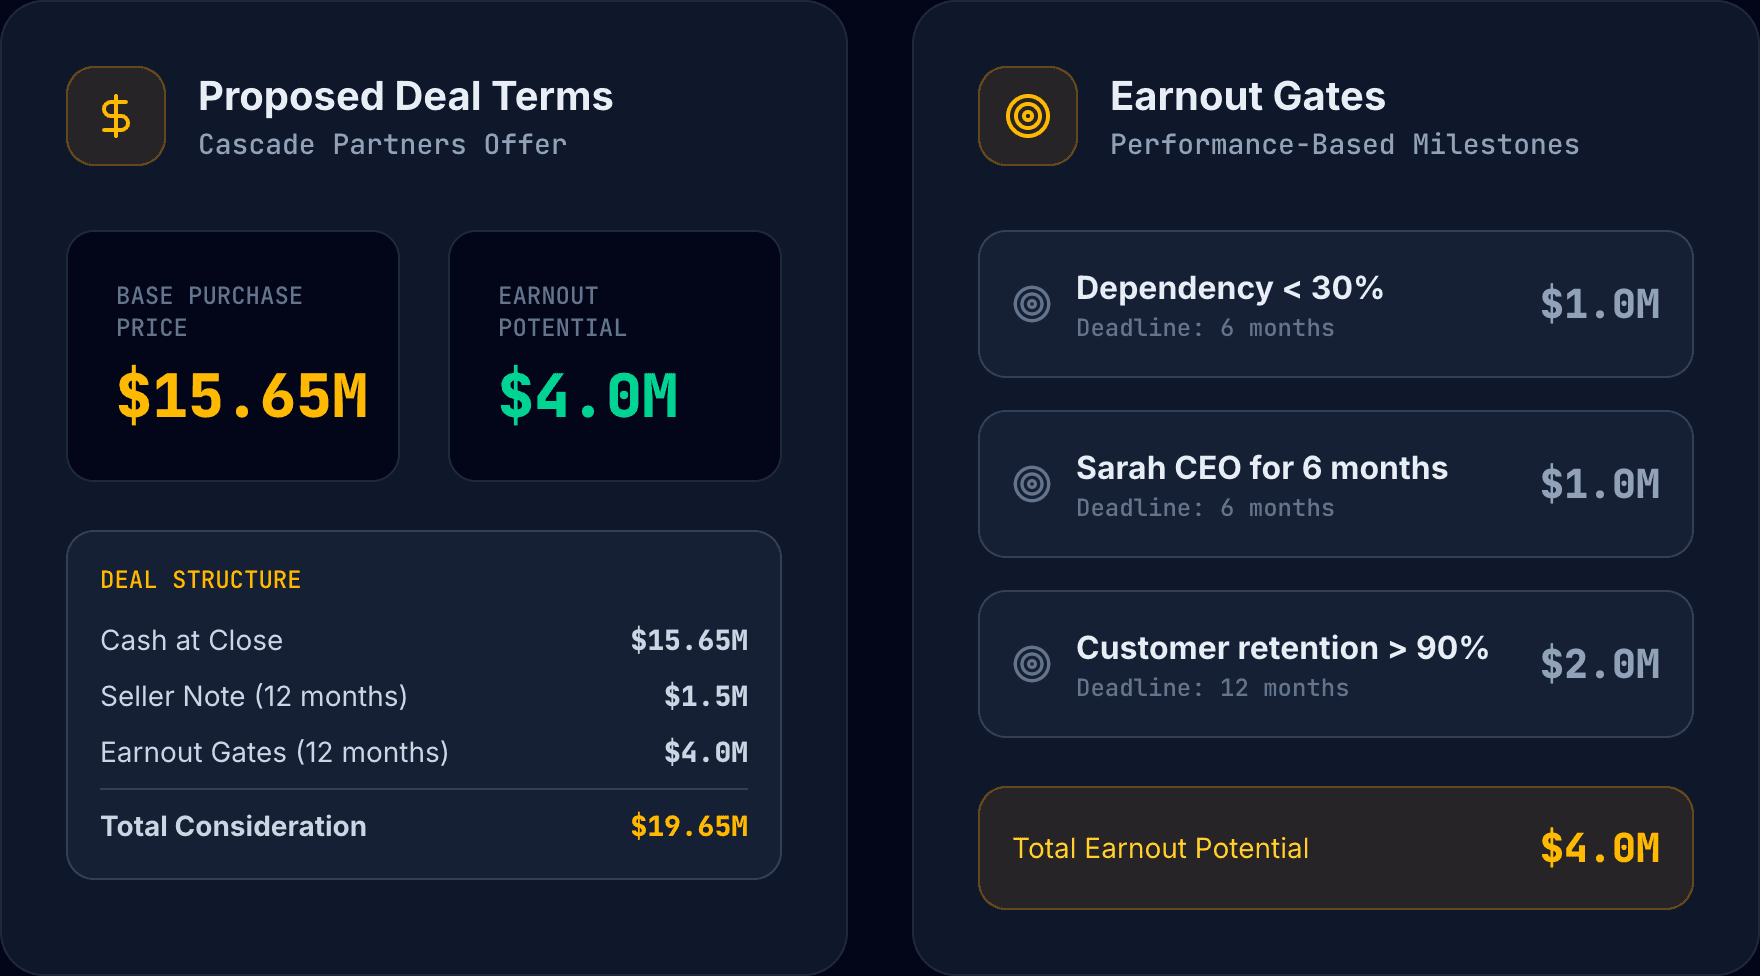
The Deal Terms section shows the proposed deal structure and performance-based milestones.
Proposed Deal Terms
| Component | Amount |
|---|---|
| Base Purchase Price | $15.65M |
| Earnout Potential | $4.0M |
Deal Structure Breakdown
| Item | Amount |
|---|---|
| Cash at Close | $15.65M |
| Seller Note (12 months) | $1.5M |
| Earnout Gates (12 months) | $4.0M |
| Total Consideration | $19.65M |
Earnout Gates
Performance-based milestones that unlock additional consideration:
| Gate | Deadline | Value |
|---|---|---|
| Dependency < 30% | 6 months | $1.0M |
| Sarah CEO for 6 months | 6 months | $1.0M |
| Customer retention > 90% | 12 months | $2.0M |
| Total Earnout Potential | $4.0M |
Tip: Earnout gates are directly tied to risks identified in the Risk Matrix. The Owner Dependency risk maps to the "Dependency < 30%" gate; the Customer Concentration risk maps to the "Customer retention > 90%" gate.
10. Protocol Recommendation
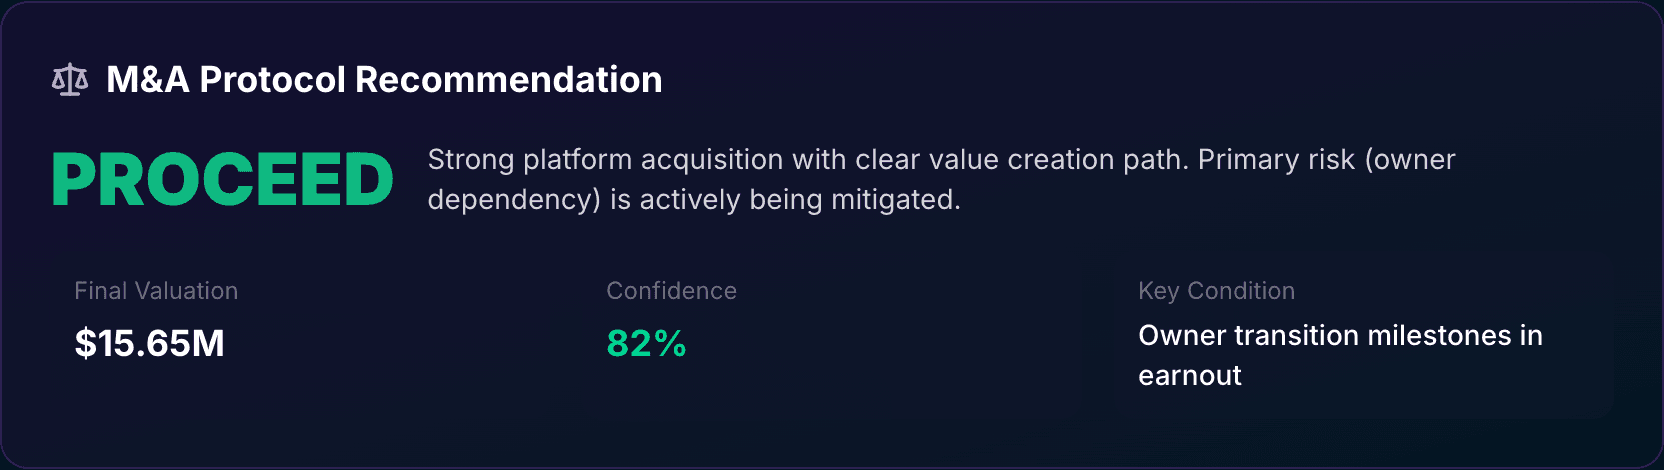
The M&A Protocol delivers a clear investment recommendation with supporting rationale.
Recommendation Outcomes
| Verdict | Meaning | Action |
|---|---|---|
| PROCEED | Risks manageable, value creation clear | Continue to closing, negotiate terms |
| CONDITIONAL | Issues to resolve before closing | Address conditions, renegotiate if needed |
| NO-GO | Deal breakers present | Walk away or fundamental restructure |
Example Recommendation
| Field | Value |
|---|---|
| Verdict | PROCEED |
| Rationale | Strong platform acquisition with clear value creation path. Primary risk (owner dependency) is actively being mitigated. |
| Final Valuation | $15.65M |
| Confidence | 82% |
| Key Condition | Owner transition milestones in earnout |
11. Due Diligence Findings
The Findings section summarizes key observations split into two categories.
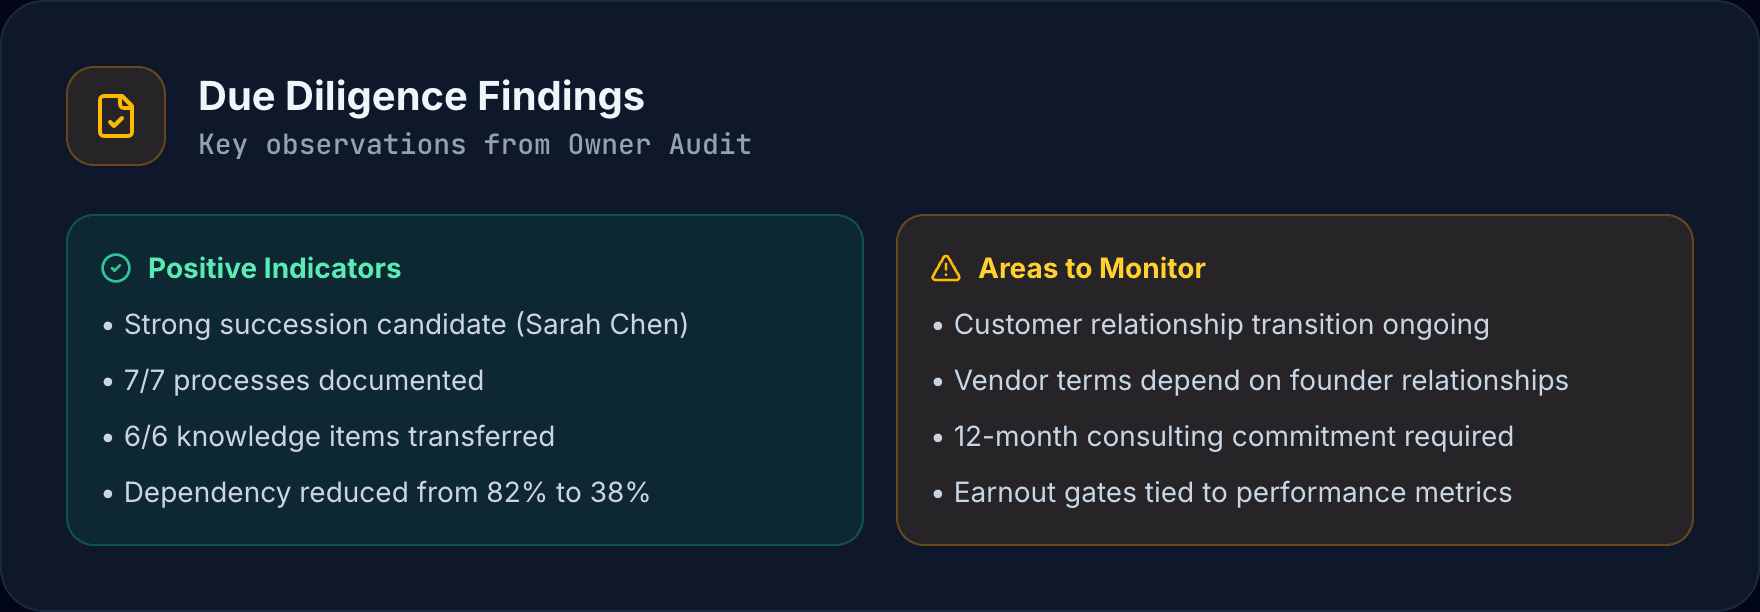
Positive Indicators
Evidence supporting the investment thesis:
Areas to Monitor
Items requiring ongoing attention post-close:
12. Exporting Results
Available Formats
| Format | Contents | Access |
|---|---|---|
| Investment memo format report | All users | |
| CSV | Structured data tables | All users |
| Console | Cypher queries over your knowledge graph | Knowledge Graph-enabled workspaces |
PDF Report Contents
How to Export
From the Results Page:
From My Analyses:
13. Best Practices
Getting Better Results
| Do This | Why |
|---|---|
| Run Key Person Audit on the target first | Provides dependency scores and valuation impact |
| Run Sales Intel on recent deals | Shows sales capability and customer quality |
| Include management interviews | Captures culture, strategy, and candid risk assessment |
| Provide financial statements | Enables EBITDA verification and margin analysis |
| Note buyer profile and rationale | Tailors synergy and integration analysis |
Red Flags to Watch
| Red Flag | Concern |
|---|---|
| Customer concentration > 30% | Revenue risk if key customer leaves |
| Key person with no backup | Business continuity risk |
| Undocumented processes | Integration complexity increases |
| Pending litigation | Liability exposure, uncertain outcomes |
| Recent key departures | Cultural issues, possible deeper problems |
Using Your Results
Quick Reference
Due Diligence Assessment Areas
| Area | What It Covers |
|---|---|
| Financial | Revenue quality, EBITDA adjustments, margins |
| Operational | Equipment, processes, quality certifications |
| Commercial | Customer retention, pipeline, market position |
| Owner Transition | Dependency score, succession readiness |
| Legal & Compliance | IP, litigation, contract assignability |
| IT & Cybersecurity | Infrastructure, security, digital readiness |
Scorecard Metrics
| Metric | Good | Concern |
|---|---|---|
| Owner Dependency | < 30% | > 60% |
| Process Documentation | > 90% | < 50% |
| Knowledge Transfer | > 80% | < 40% |
| Succession Readiness | > 75% | < 50% |
| Operational Continuity | > 70% | < 50% |
Risk Matrix Interpretation
| Impact + Probability | Action Required |
|---|---|
| Critical + High | Potential deal breaker — address or walk |
| High + Medium | Negotiate price adjustment or earnout |
| Medium + Medium | Plan mitigation, monitor post-close |
| Medium + Low | Standard integration planning |
Related Documentation
Need help? Contact [email protected]
Need help? Contact [email protected].